Data insights: August EBT theft trends

Return to Propel's EBT Theft Hub
Key findings#key-findings
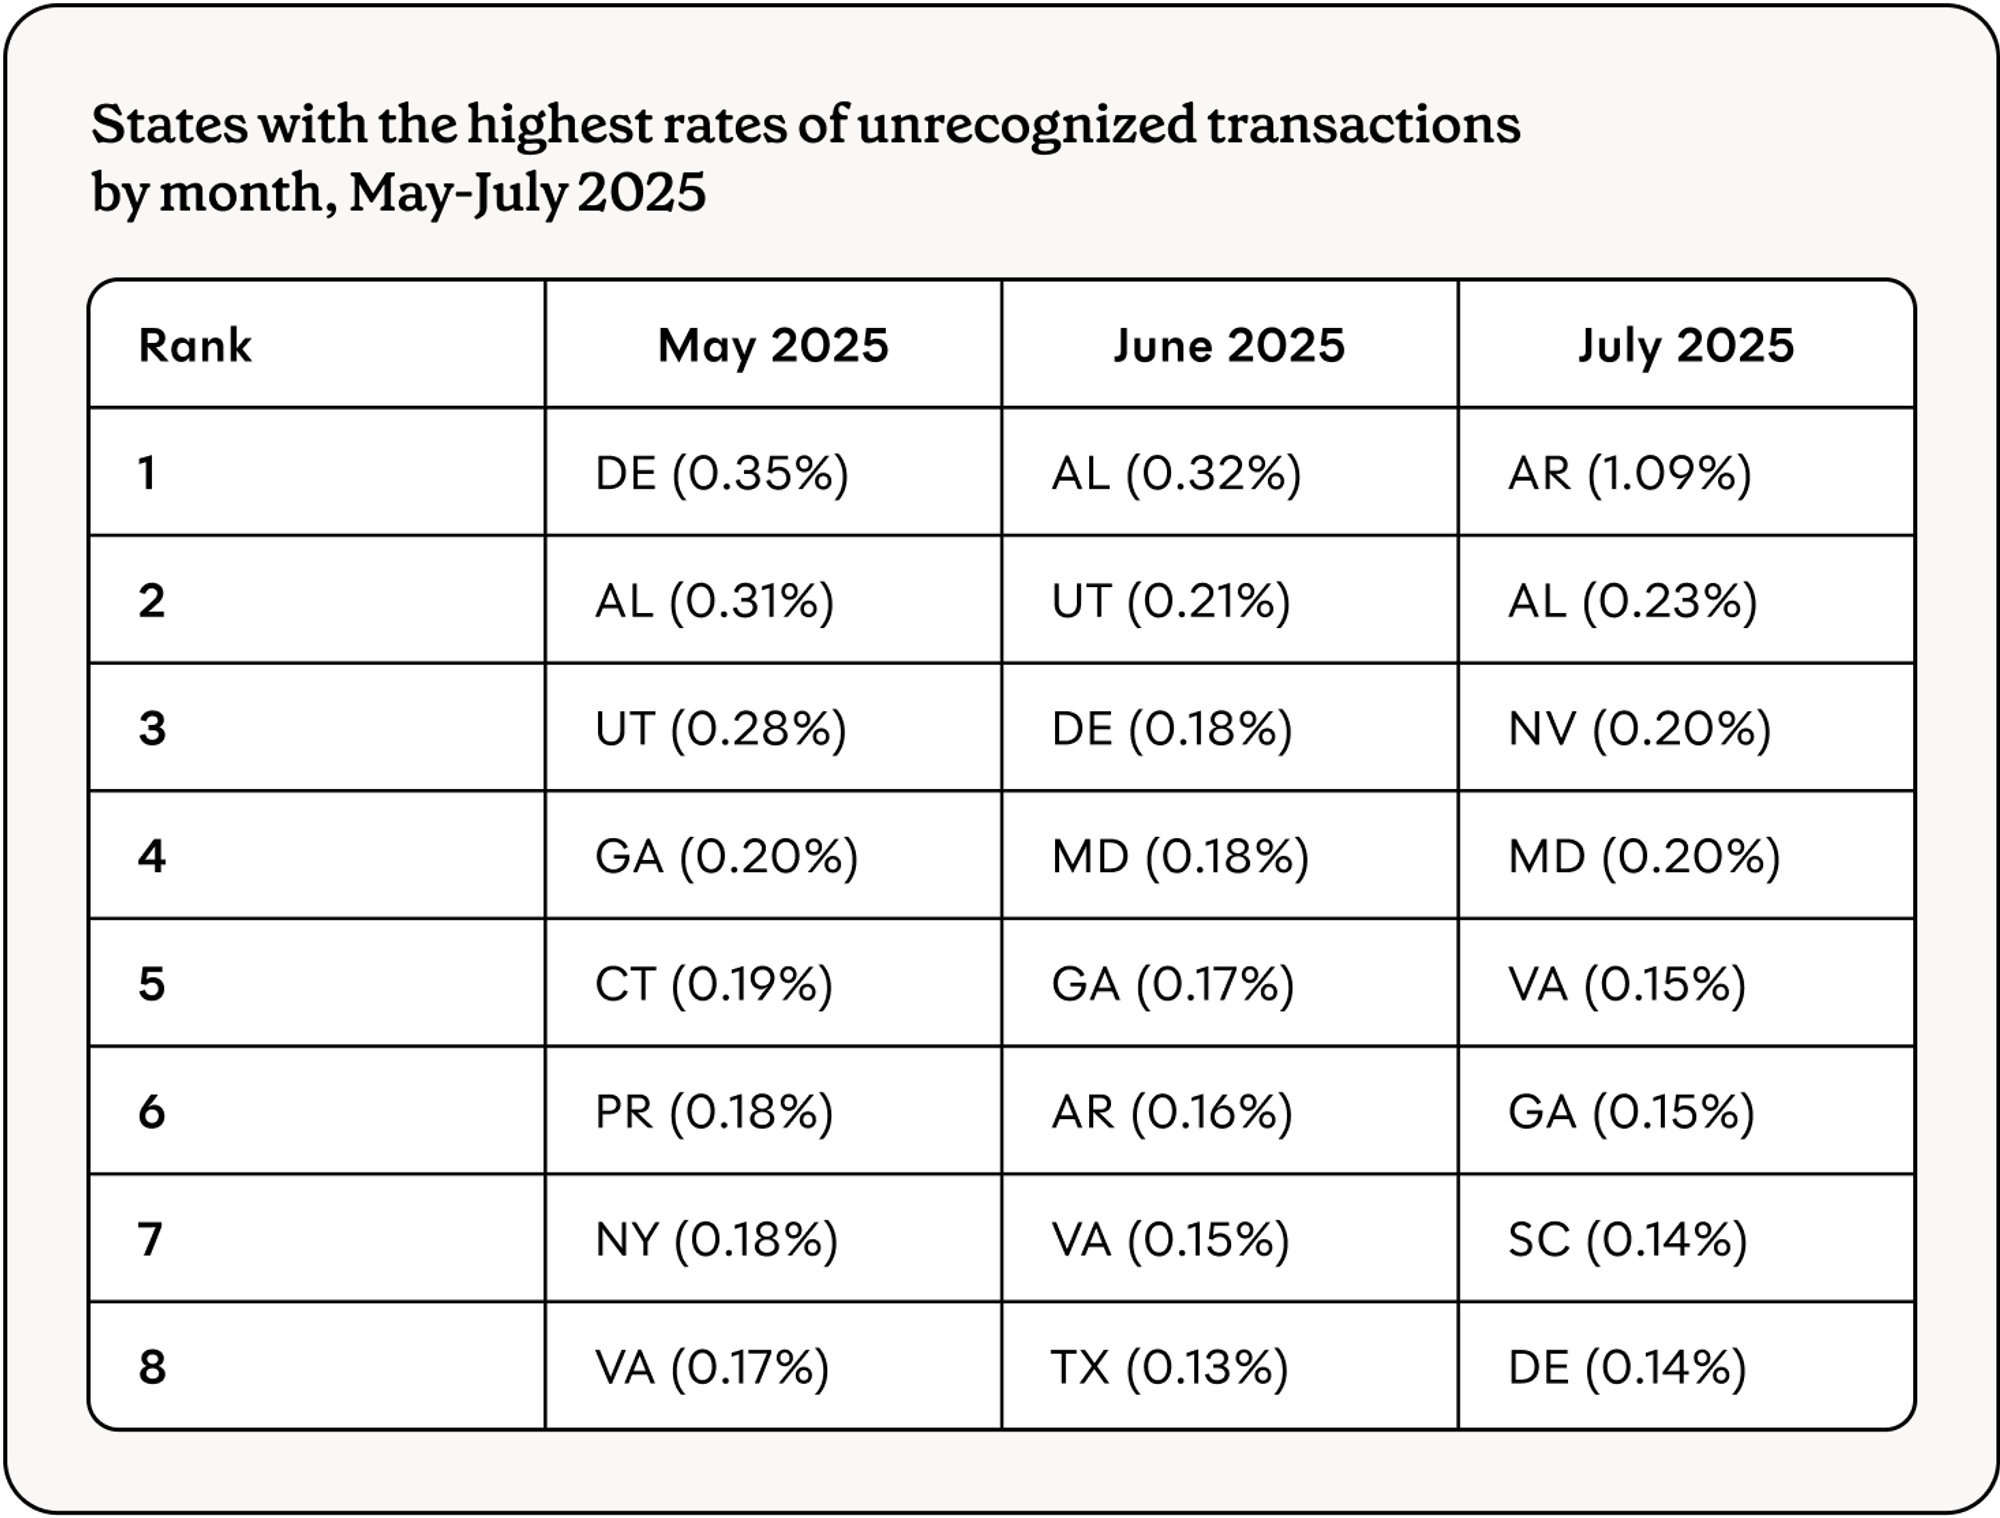
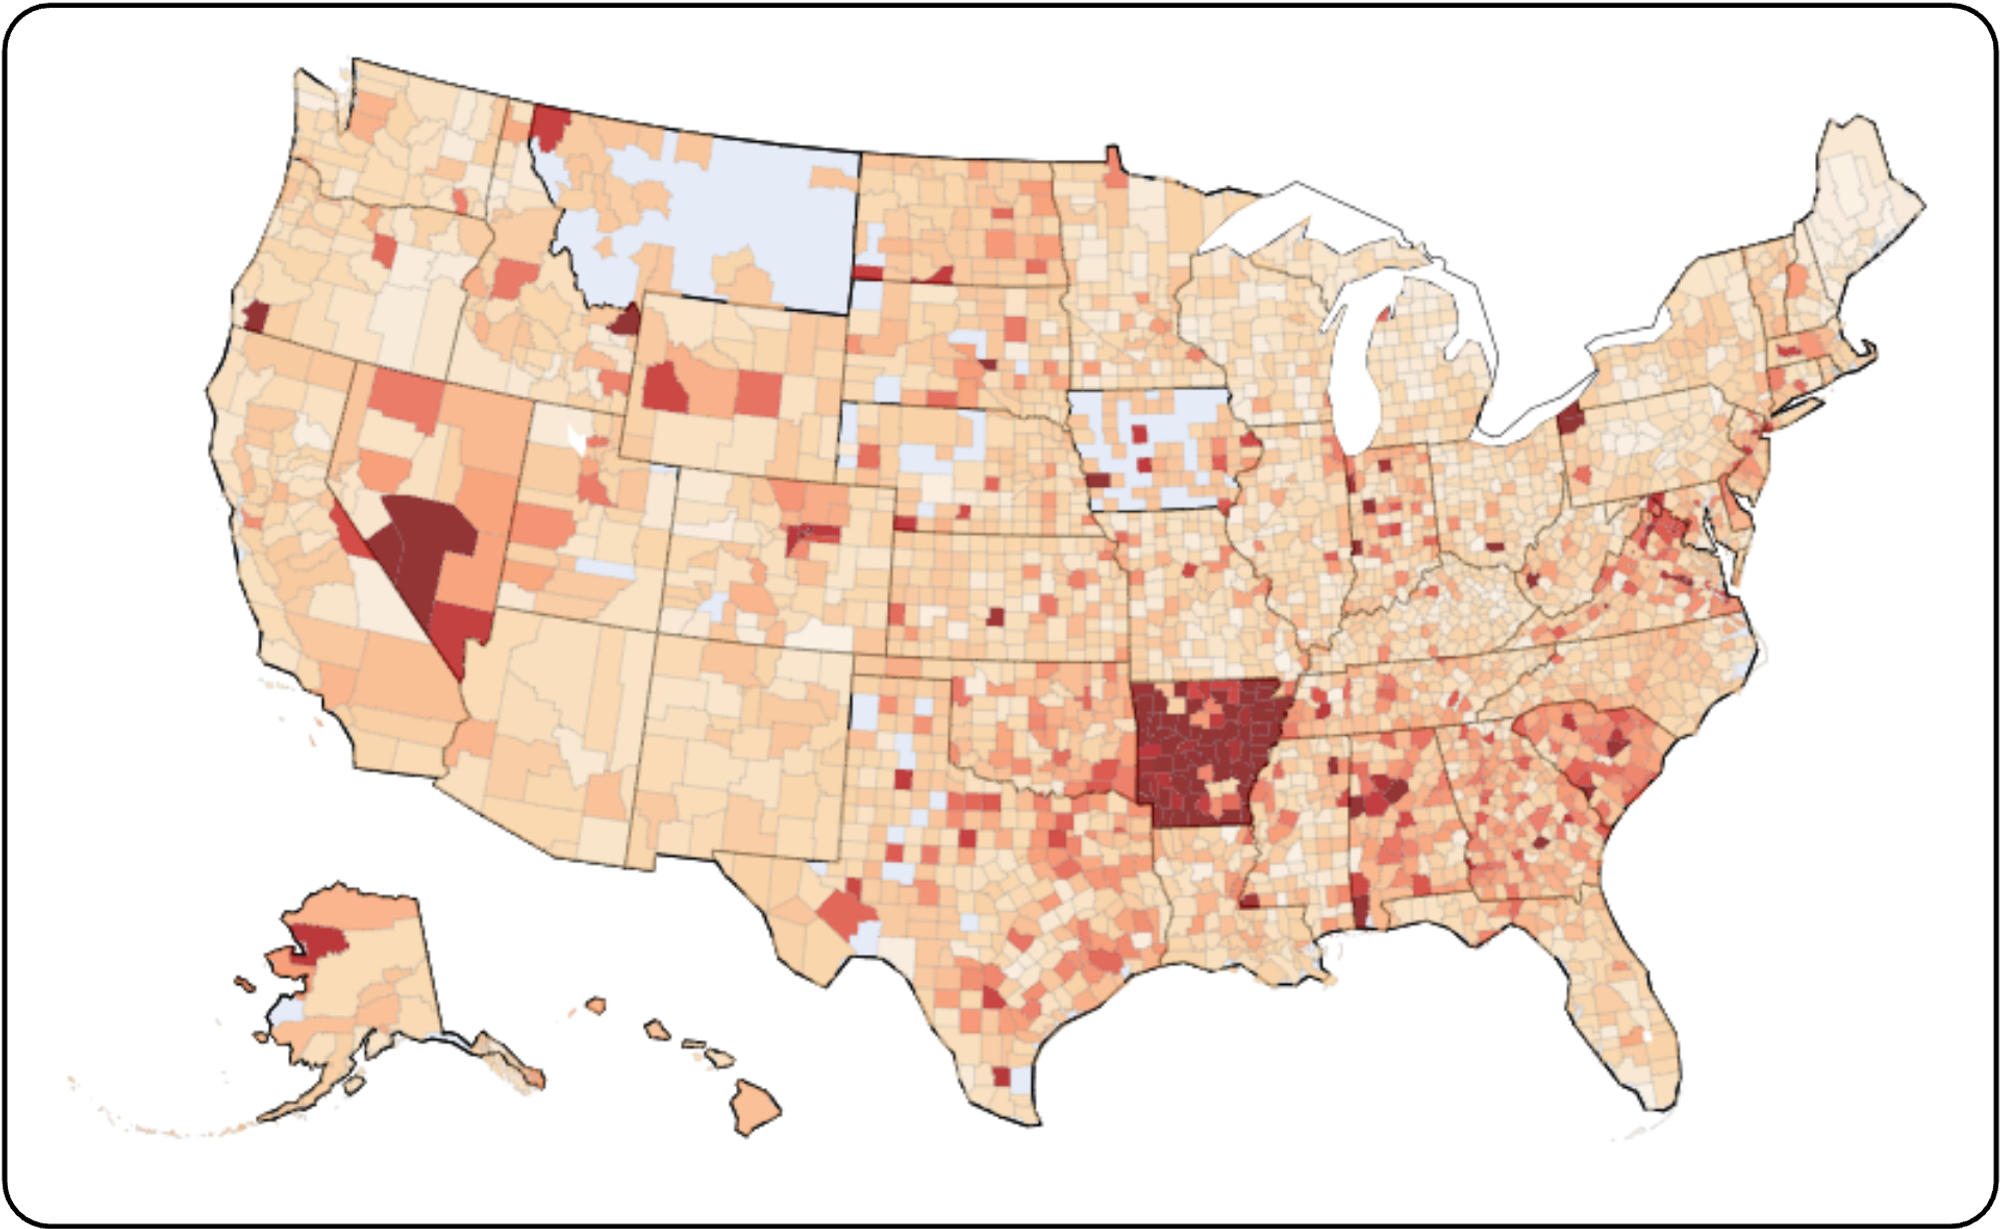
- Arkansas has emerged as a major hot spot for EBT theft victimization, with a pattern of statewide theft reaching extremely high levels in July and early August
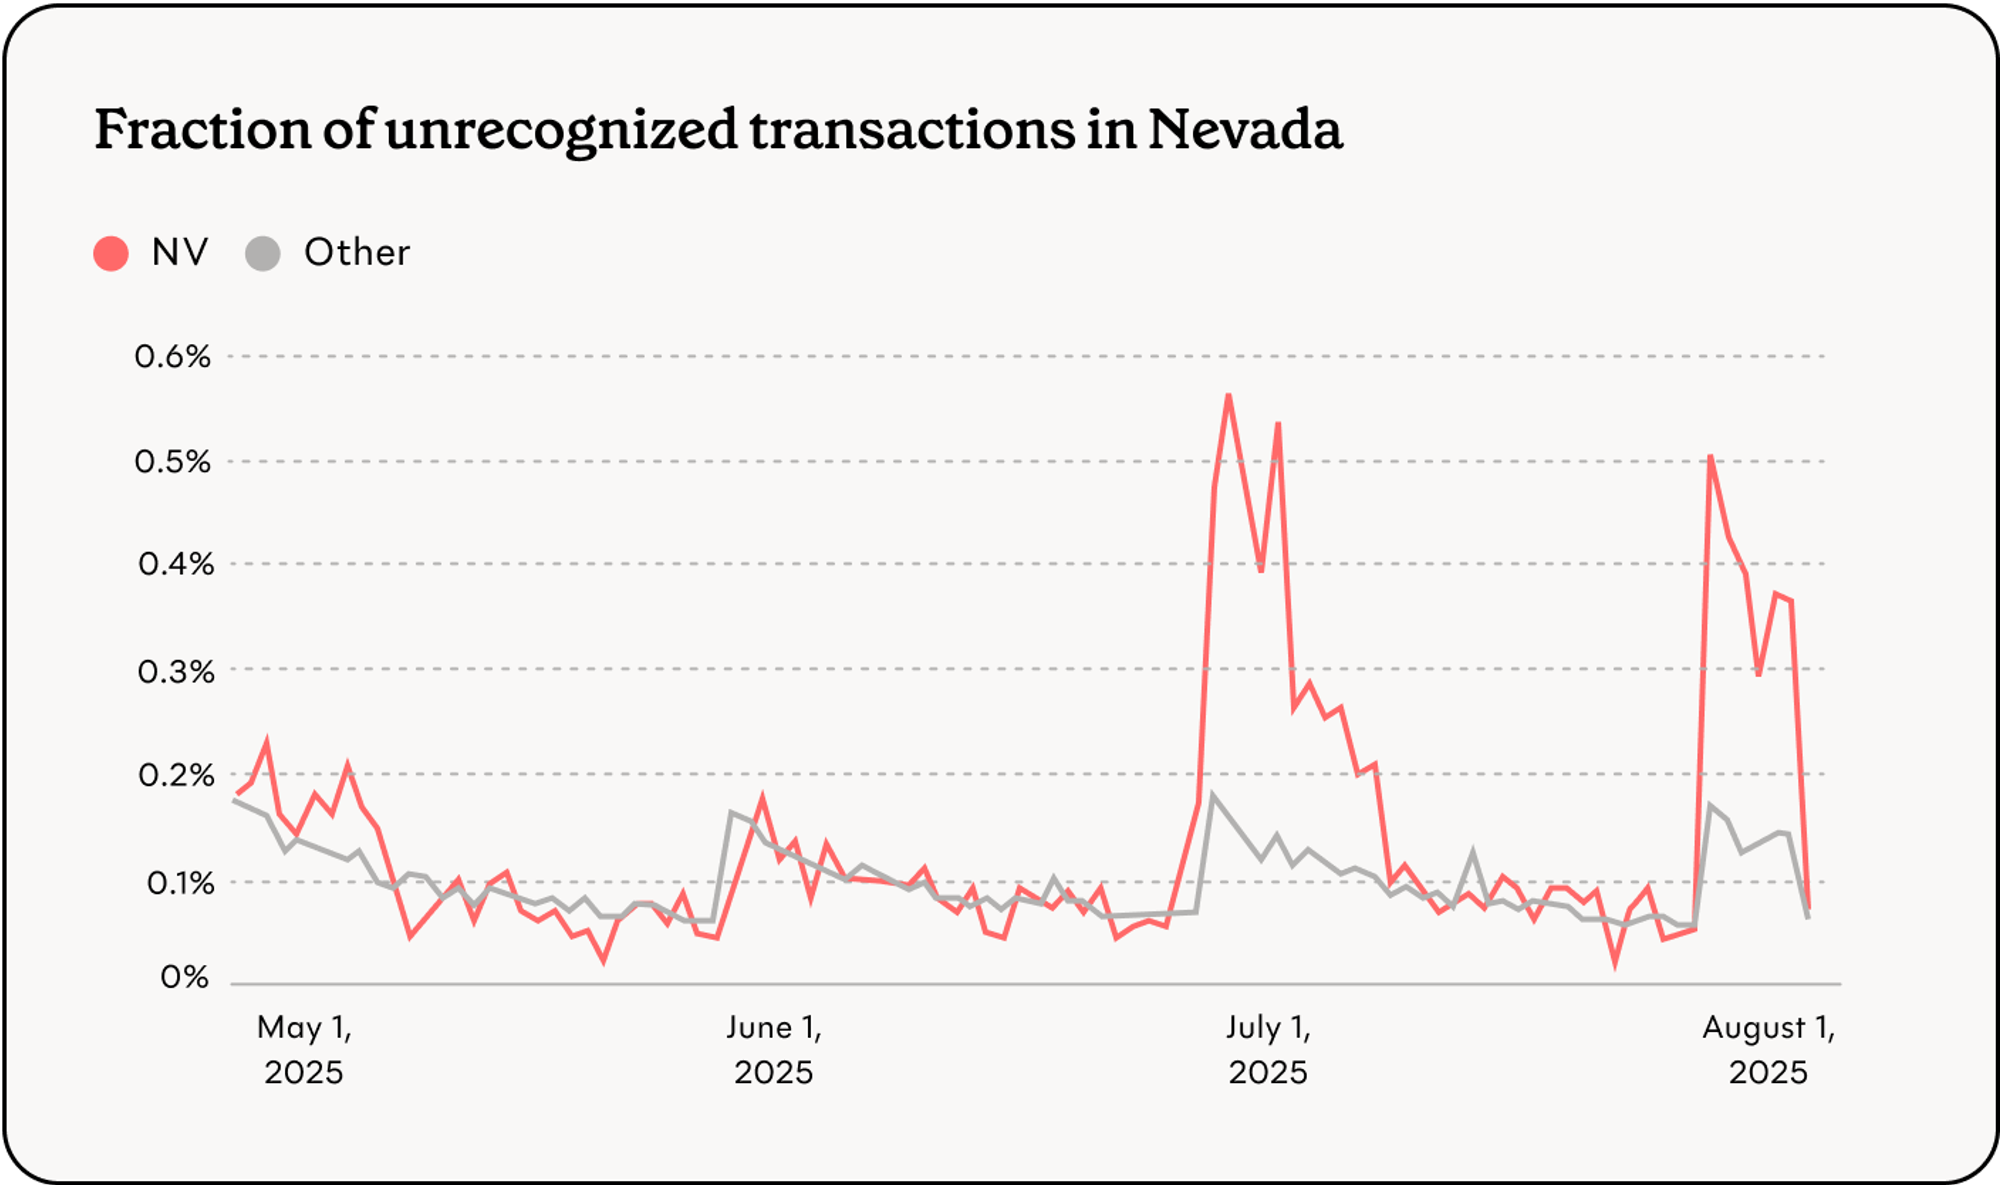
- Nevada is also seeing a large increase in both July and early August
- Four of June’s Top 5 states for theft rates saw lower theft rates in July, with Maryland being the exception to this trend
Propel’s theft detection capabilities#propels-theft-detection-capabilities
Propel serves over 5 million EBT cardholders nationwide who use our app to manage their benefits every month. We analyze transaction and customer-reported data to identify emerging theft patterns through a two-step detection process. First, we identify retailers with unusually high rates of transactions flagged as "unrecognized" by Propel users. These are retailers where stolen benefits appear to be drained or liquidated. Second, we identify skimmer locations by analyzing victims’ shopping patterns in the 8-12 weeks prior to their card being liquidated.
Our insights are intended to provide a snapshot of emerging trends in EBT theft. We generate these analyses early in the month, when theft activity typically peaks following SNAP benefit deposits. Our data reflects real theft activity, but may show a slight upward bias since cardholders are more likely to check the app after experiencing theft. Given the rapidly evolving nature of EBT theft, our insights represent a current snapshot rather than a comprehensive assessment.
Recent theft patterns and spikes#recent-theft-patterns-and-spikes
Final data from July and early data from August shows noteworthy developments in Arkansas and Nevada, and a substantial decline in most of last month’s top five states.
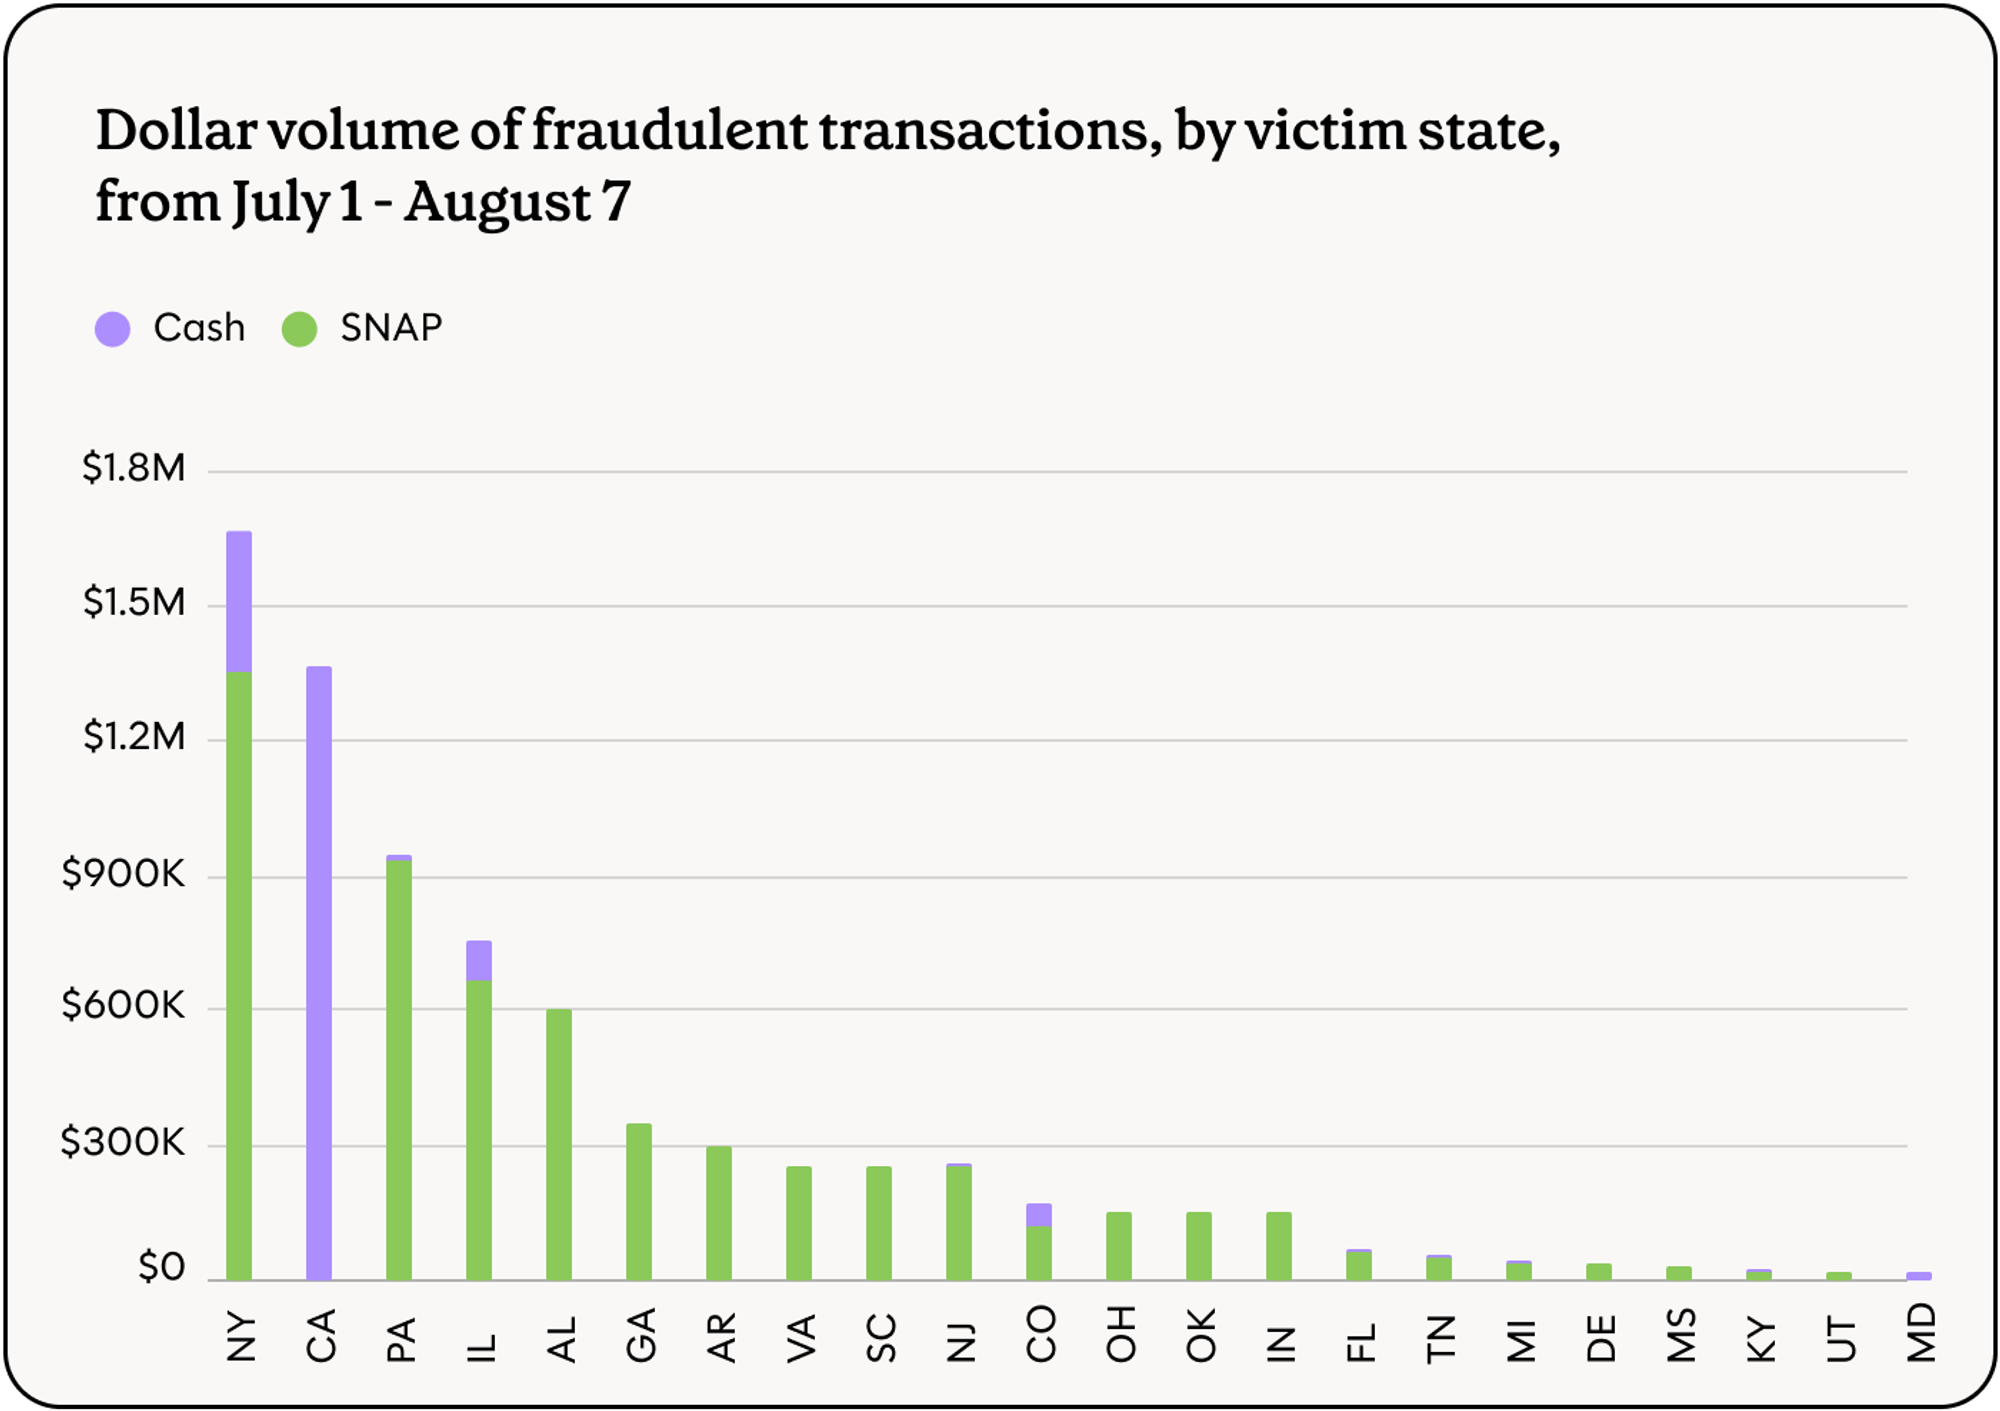
Fraudulent transaction volume is still skewed toward states with higher populations; 50% of stolen dollars July 1 - August 7 was from users in New York, California, and Pennsylvania.
Arkansas#arkansas
8% of Arkansas users had a transaction at a retailer identified as fraudulent from July 1 - August 7 (3% of Arkansas user transactions were at these retailers). All retailers identified as fraudulent are out of state and many appear to be in the Philadelphia area. As of today, Arkansas is one of six states that does not allow users to block out of state transactions or lock their cards.
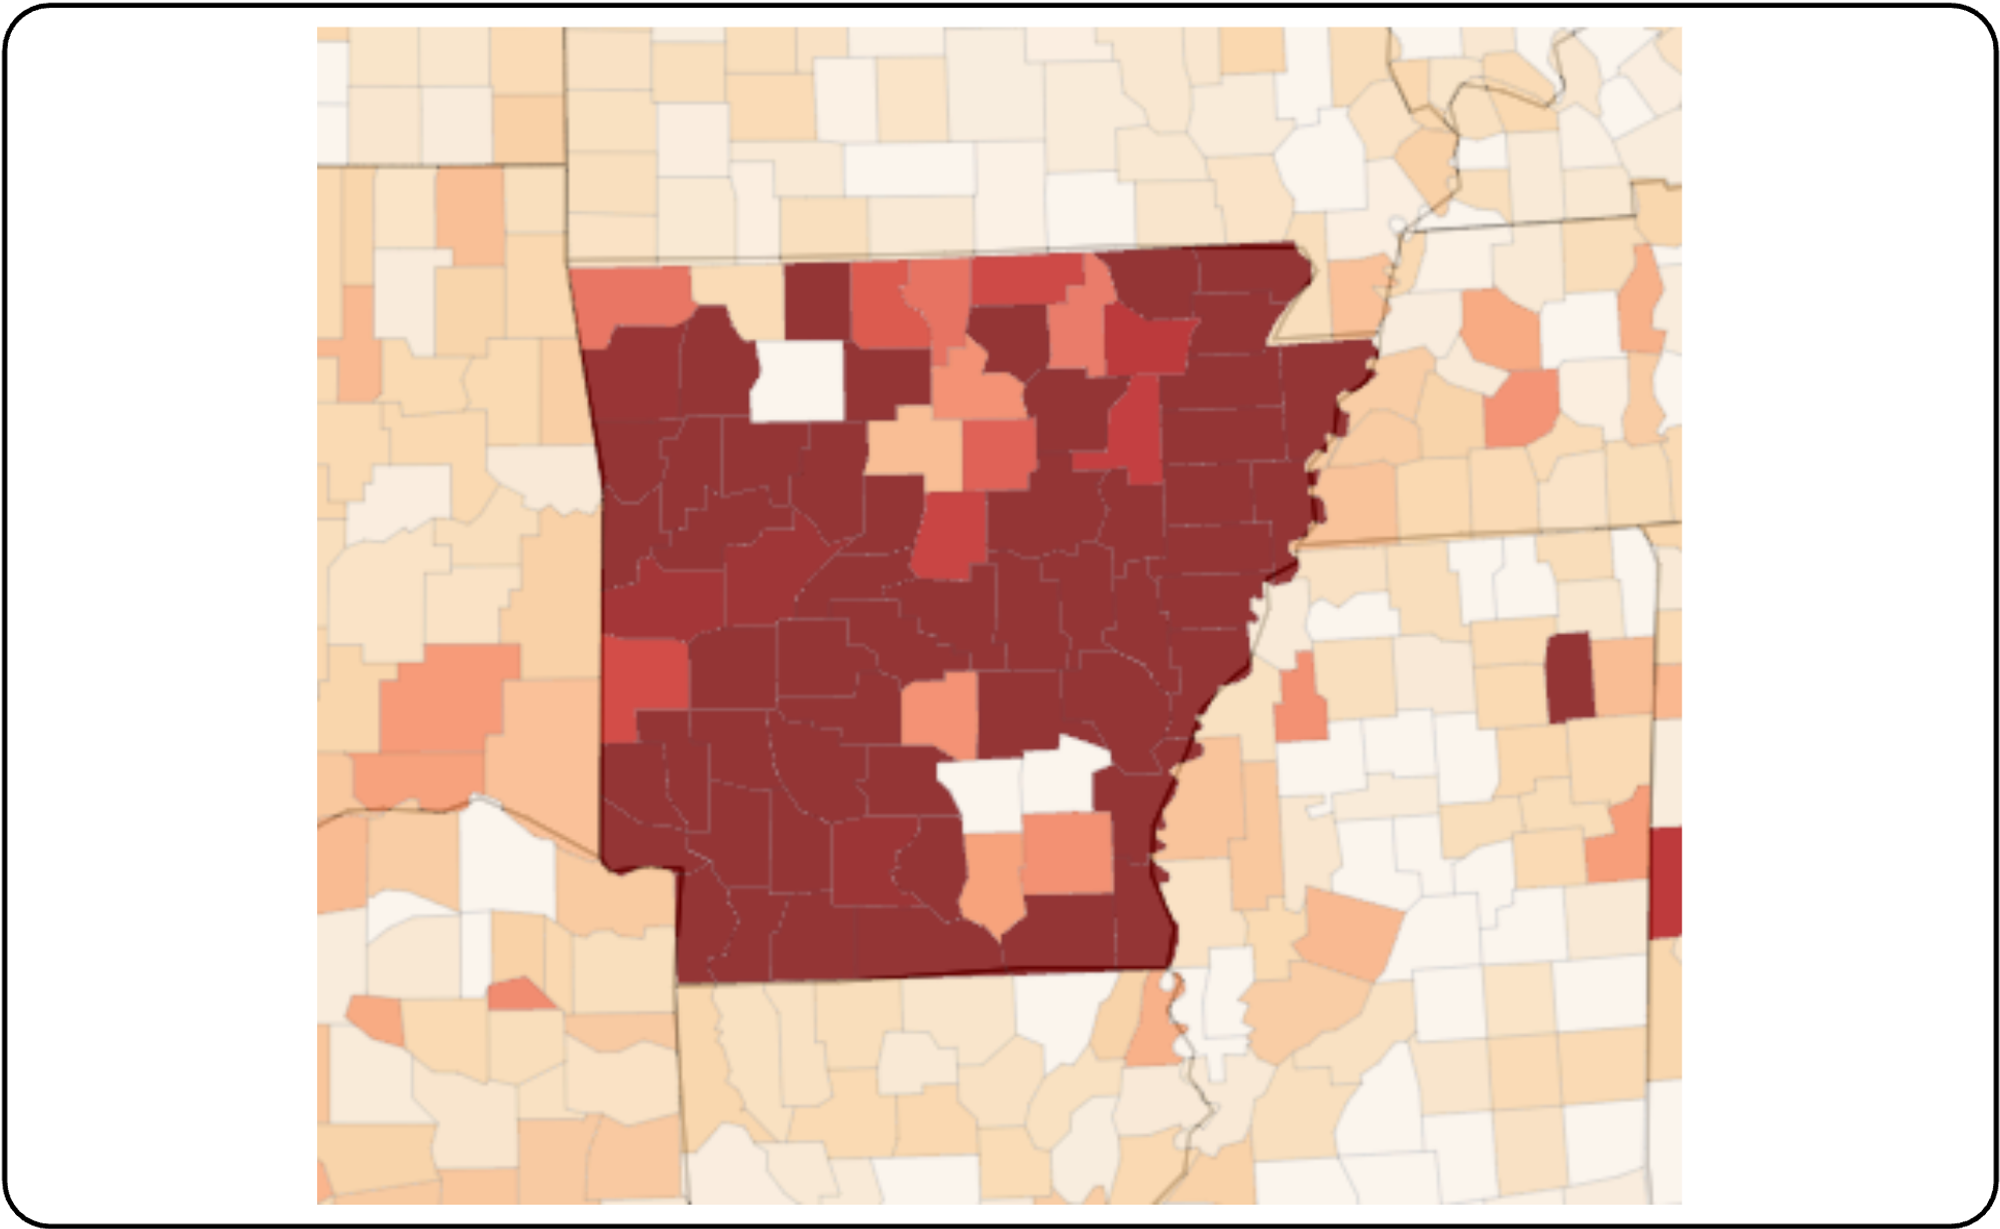
Elevated unrecognized tap rates in almost every county and sharp borders across state lines indicate state-level fraud rather than theft facilitated by skimmers.
Nevada#nevada
Nevada saw similar spikes in unrecognized transactions at the beginning of July and August. This is a new trend – Nevada theft levels were similar to other states in June.
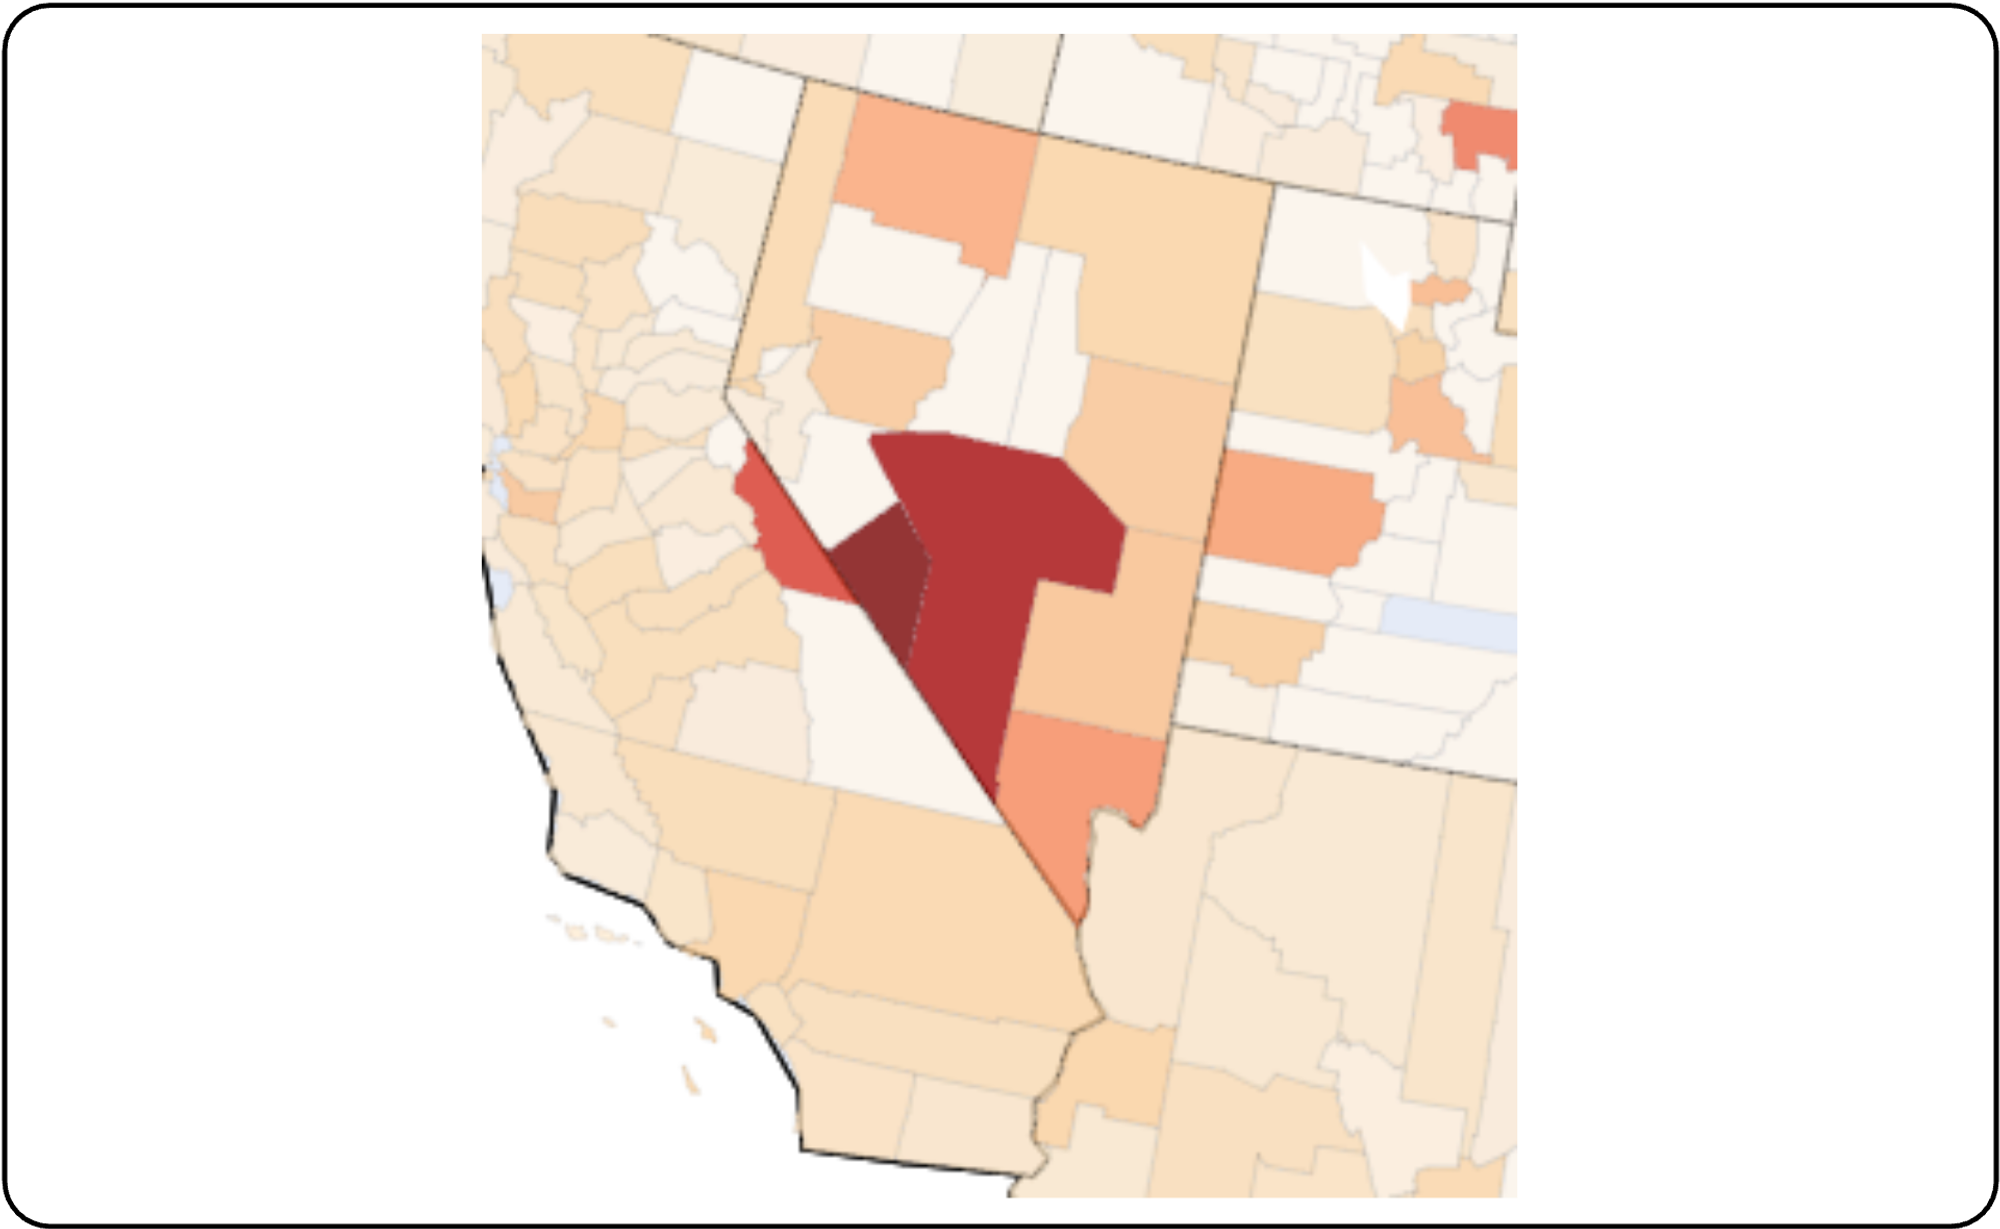
Based on geographical patterns, this theft seems to be the result of skimming – unrecognized transaction rates are concentrated in a few southern counties. However, it is difficult to attribute Nevada theft to skimming because:
- Nevada does not show retailer names to users in their transaction history (instead, it shows a generic descriptions, e.g. “Food Purchase”)
- Most counties in central and northern Nevada have few users
Implications & next steps#implications-and-next-steps
One takeaway from this data is that the “hottest” theft locations change rapidly, criminal rings engaged in EBT theft are not bound to one or several states, and states experiencing a decline in theft activity are likely better off interpreting that as a lull, and not a long-term change in their vulnerability. In the near term, it may warrant alerts to affected areas, law enforcement coordination, and ongoing monitoring. It may also warrant implementation of established solutions from the financial services industry, like chip cards and real-time transaction blocking, for EBT.
Propel is committed to supporting state and federal agencies in protecting SNAP recipients from EBT theft. For questions about our methodology or further analysis, please contact gov@joinpropel.com.