Data insights: December 2025 EBT theft trends
Our editorial promise
All of our Propel editorial content meets our high bar for accuracy, timeliness, trust, and relevance. Our pages are edited and fact-checked to make sure we meet our mission of giving you information you can rely on.
Learn more about our editorial standards.
Return to Propel's EBT Theft Hub
Key findings#key-findings
- The overall amount of theft declined in November 2025.
- This is likely due to the benefits delivery delay caused by the extended federal government shutdown.
- Theft patterns related to the delay strongly reinforces the notion that balance checking precedes theft attempts.
- Maryland and Utah saw increases in their theft rate and were the two most highly victimized states in November.
- Mississippi continues to show a pattern of theft influenced by a large-scale skimming operation.
- California is the only state that saw an increase in theft volume from October to November.
Propel’s theft detection capabilities#propels-theft-detection-capabilities
Propel serves over 5 million EBT cardholders nationwide who use our app to manage their benefits every month. We analyze transaction and customer-reported data to identify emerging theft patterns through a two-step detection process. First, we identify retailers with unusually high rates of transactions flagged as "unrecognized" by Propel users. These are retailers where stolen benefits appear to be drained or liquidated. Second, we identify skimmer locations by analyzing victims’ shopping patterns in the 8-12 weeks prior to their card being liquidated.
Our insights are intended to provide a snapshot of emerging trends in EBT theft. We generate these analyses early in the month, when theft activity typically peaks following SNAP benefit deposits. Our data reflects real theft activity, but may show a slight upward bias since cardholders are more likely to check the app after experiencing theft. Given the rapidly evolving nature of EBT theft, our insights represent a current snapshot rather than a comprehensive assessment.
Recent theft patterns and spikes#recent-theft-patterns-and-spikes
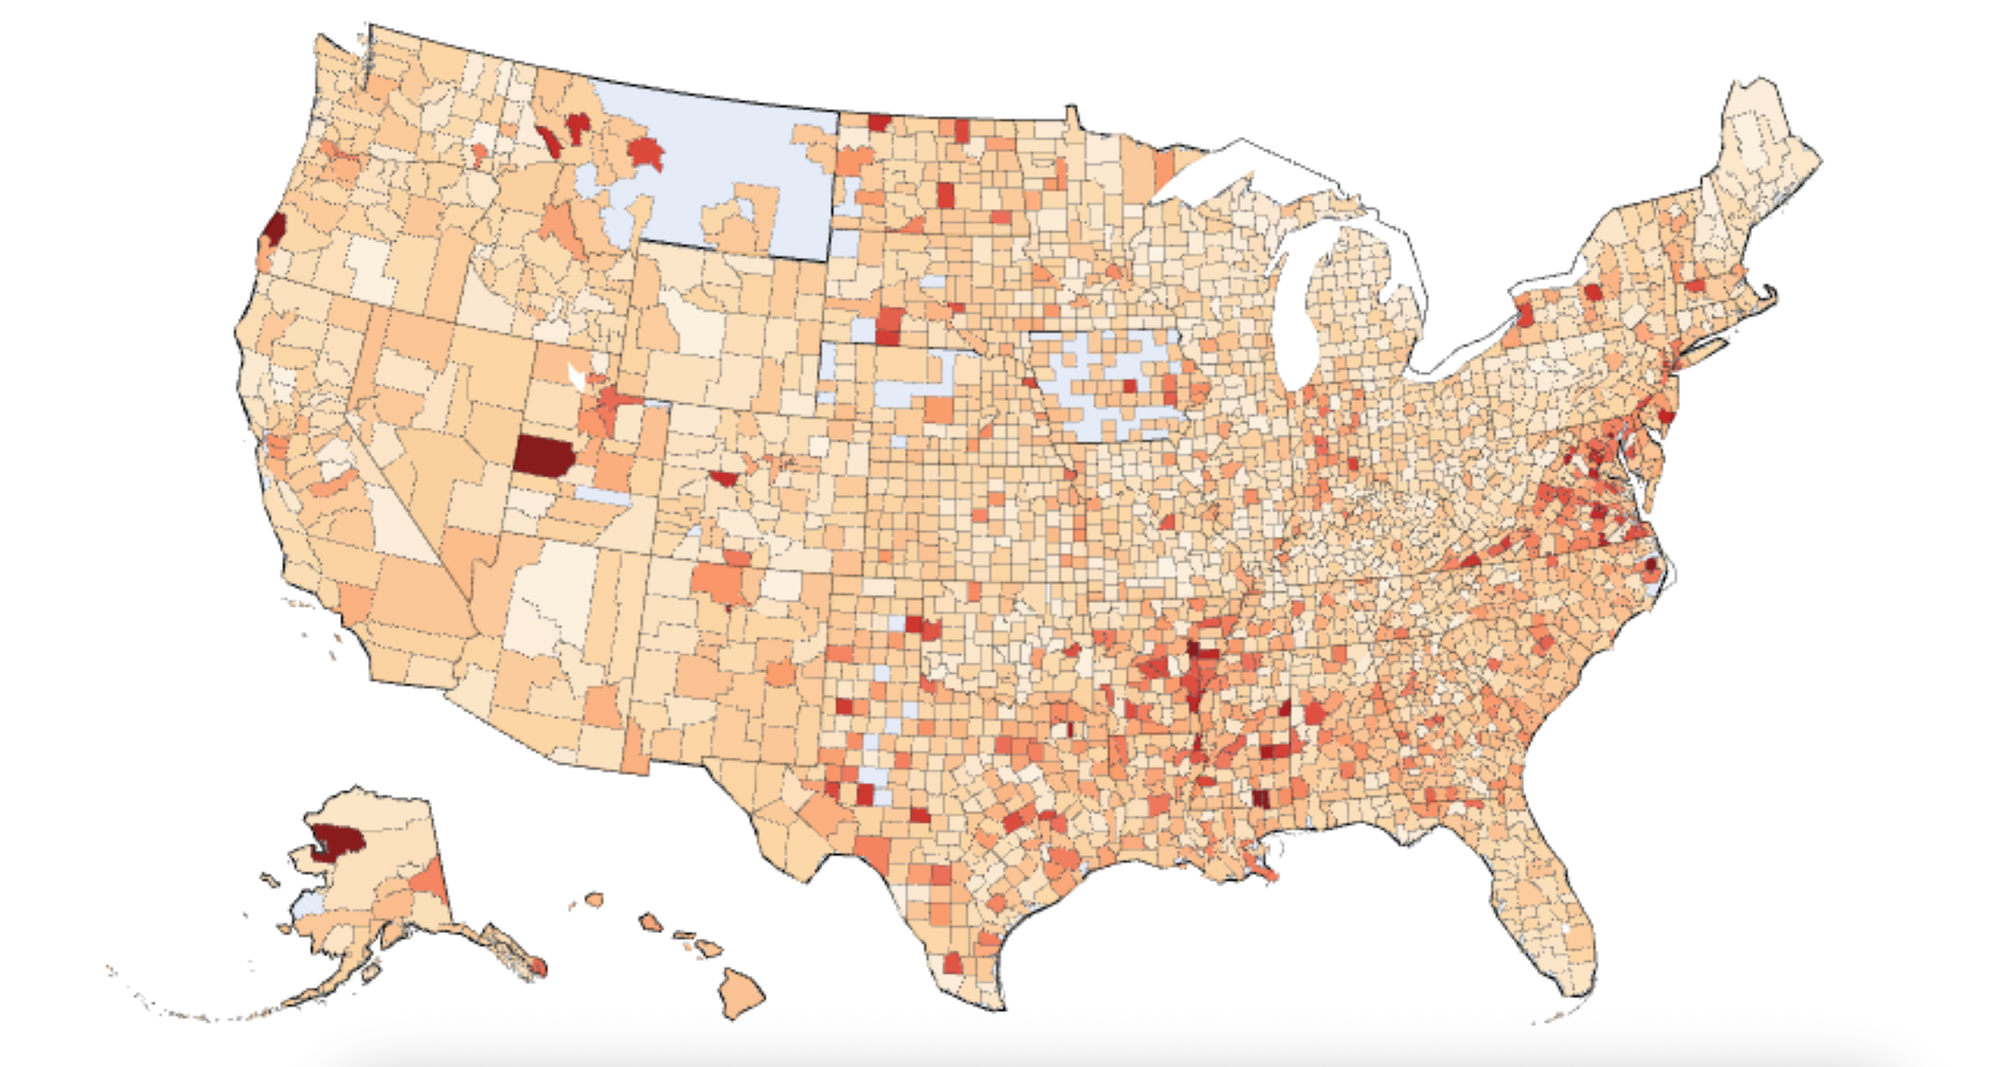
Theft declined in November, likely due to the benefits delivery delay during the shutdown. Maryland and Utah both saw increases in theft rate, but neither state’s increase has a clear source (skimming or a statewide compromise). New states in the top 10 for theft rate this month include New Jersey, Pennsylvania, Utah, and Virginia.
| Rank | Sep 2025 | Oct 2025 | Nov 2025 |
|---|---|---|---|
| 1 | MS (0.24%) | AR (0.20%) | MD (0.19%) |
| 2 | TN (0.16%) | AL (0.16%) | UT (0.16%) |
| 3 | AL (0.15%) | MD (0.16%) | AR (0.15%) |
| 4 | IN (0.15%) | TN (0.13%) | MS (0.13%) |
| 5 | NV (0.13%) | MS (0.12%) | VA (0.12%) |
| 6 | MD (0.13%) | GA (0.12%) | PA (0.12%) |
| 7 | DC (0.13%) | NY (0.11%) | NJ (0.11%) |
| 8 | AZ (0.12%) | CO (0.11%) | NY (0.11%) |
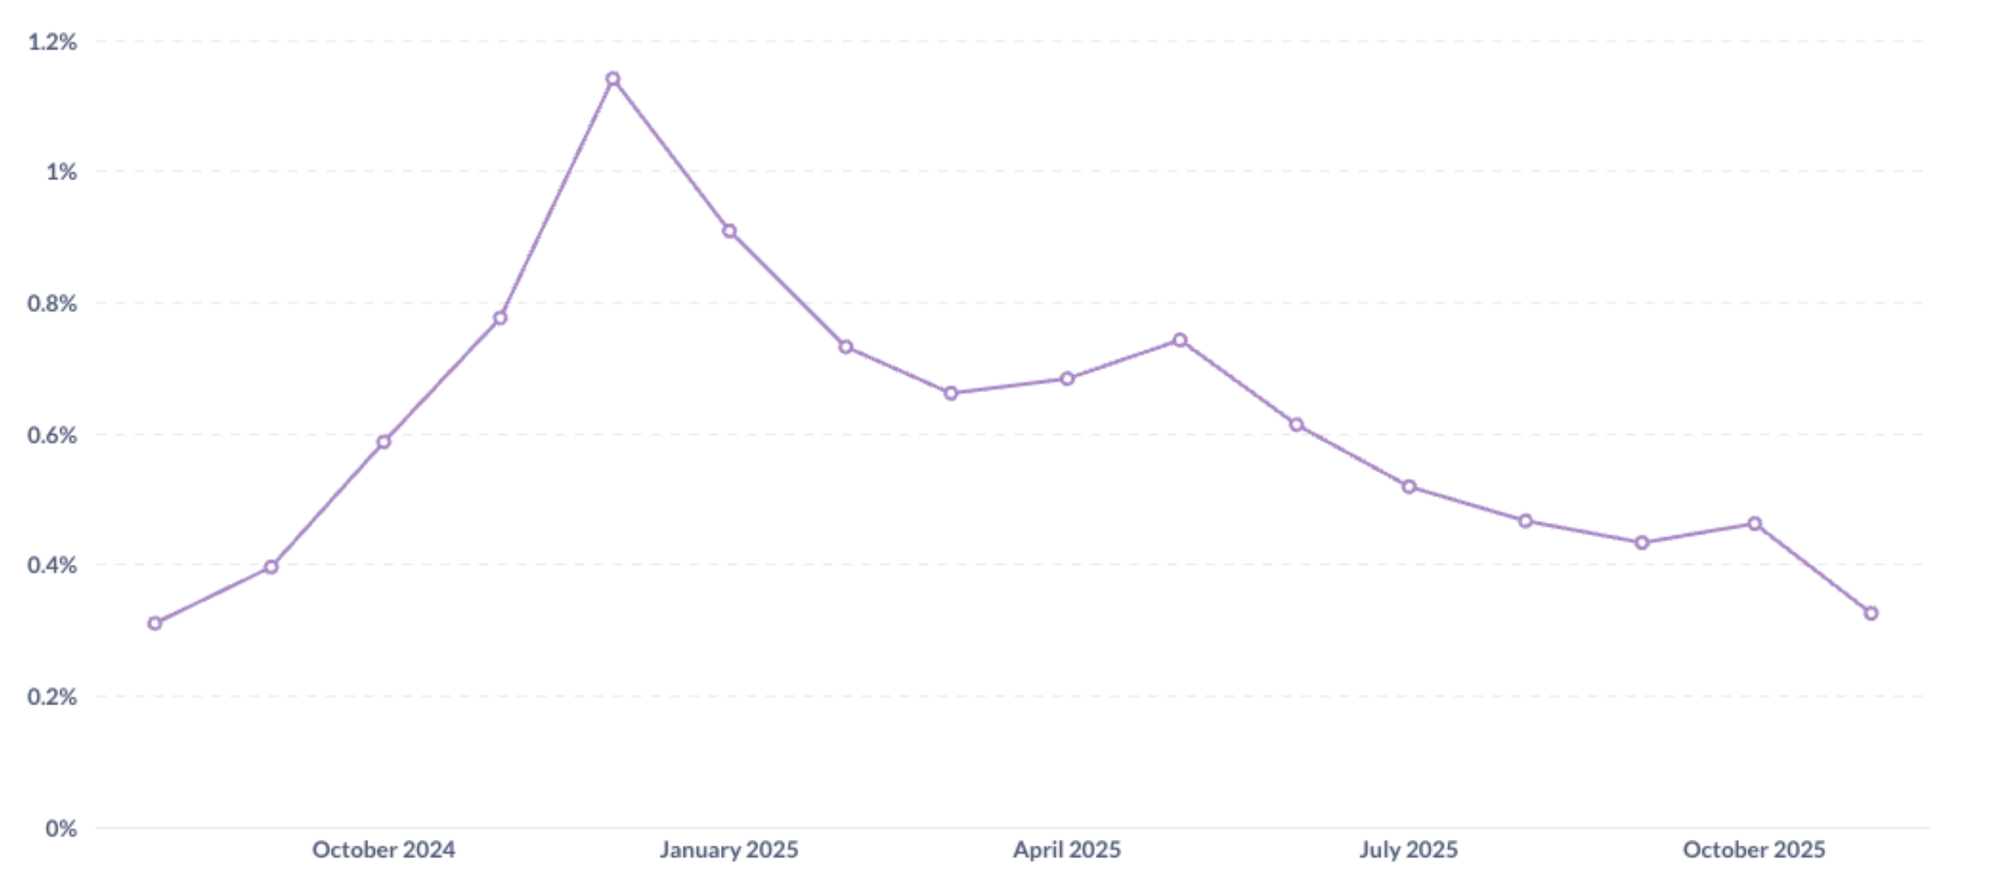
Theft decrease in November#theft-decrease-in-november
From October to November, theft saw a large decrease. While theft has generally been declining since its high in late 2024, this month to month relative change is greater than any we’ve seen this year. It’s likely the shutdown had an impact. Only a quarter of SNAP deposits arrived on their expected day in November (56% were late and 18% were early).
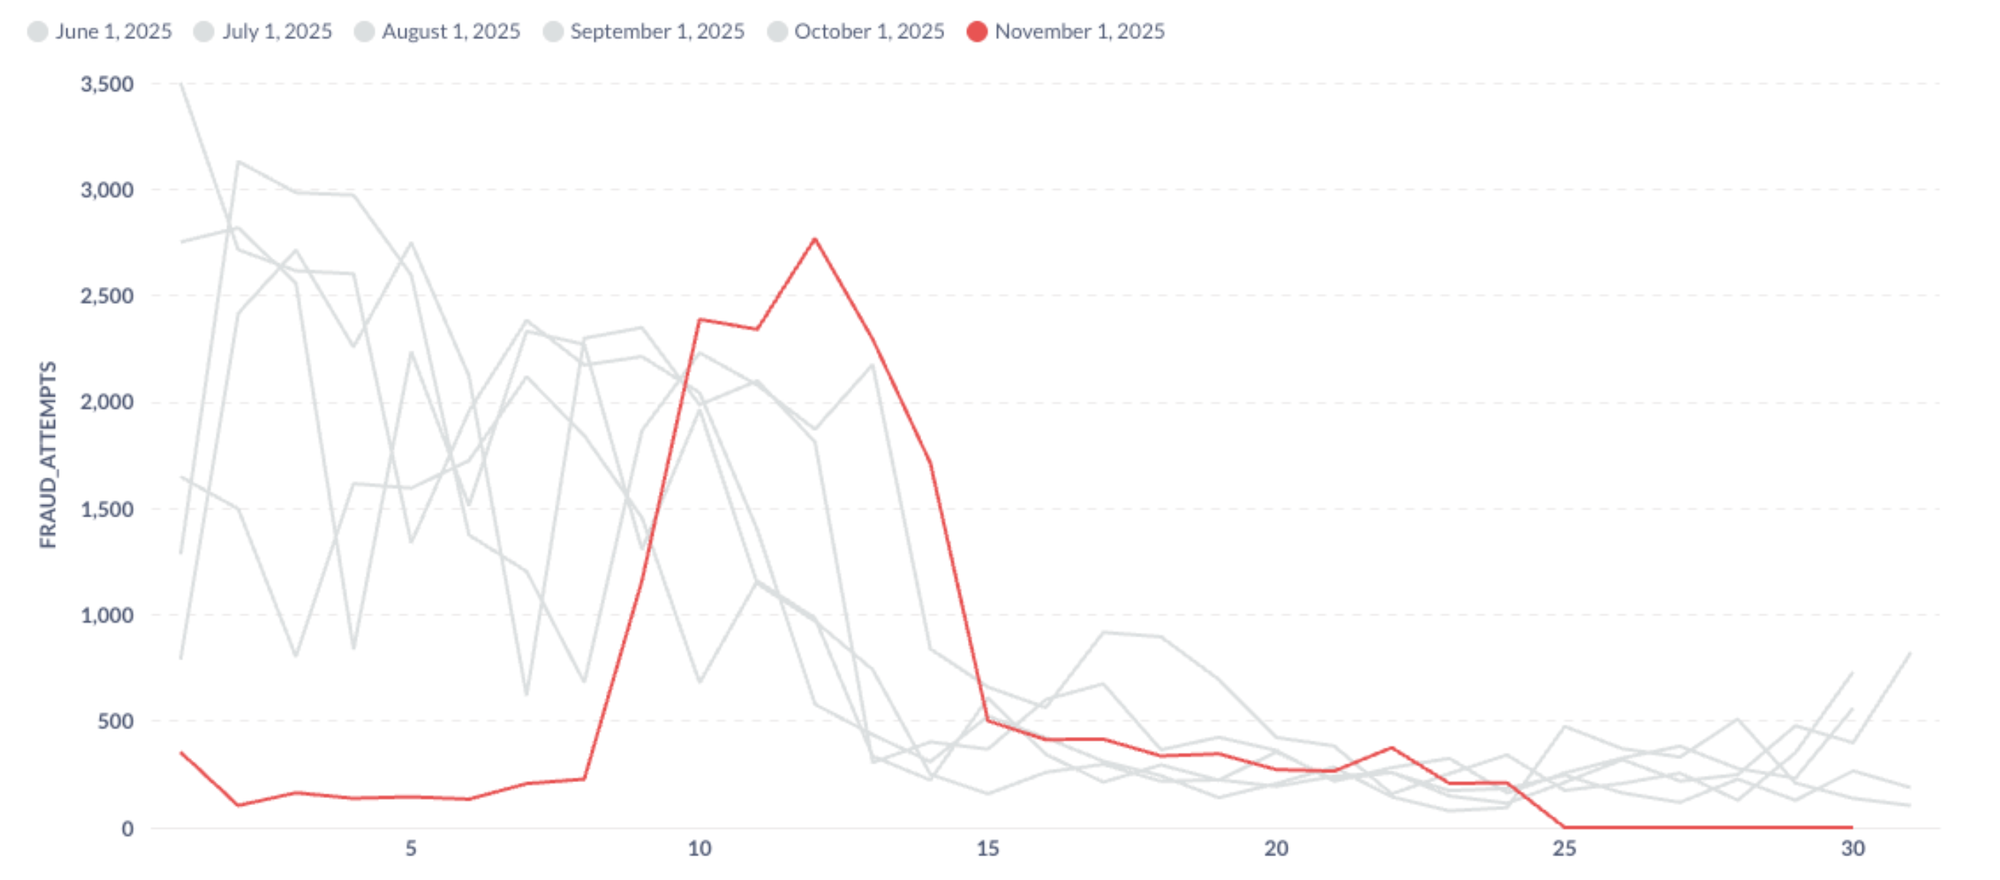
Daily fraud volume shifted in line with deposit availability. In most months, fraud begins at the start of the month and remains elevated until the 12th-14th. In November, the time period with fraudulent activity was much shorter – only the 9th through 14th.
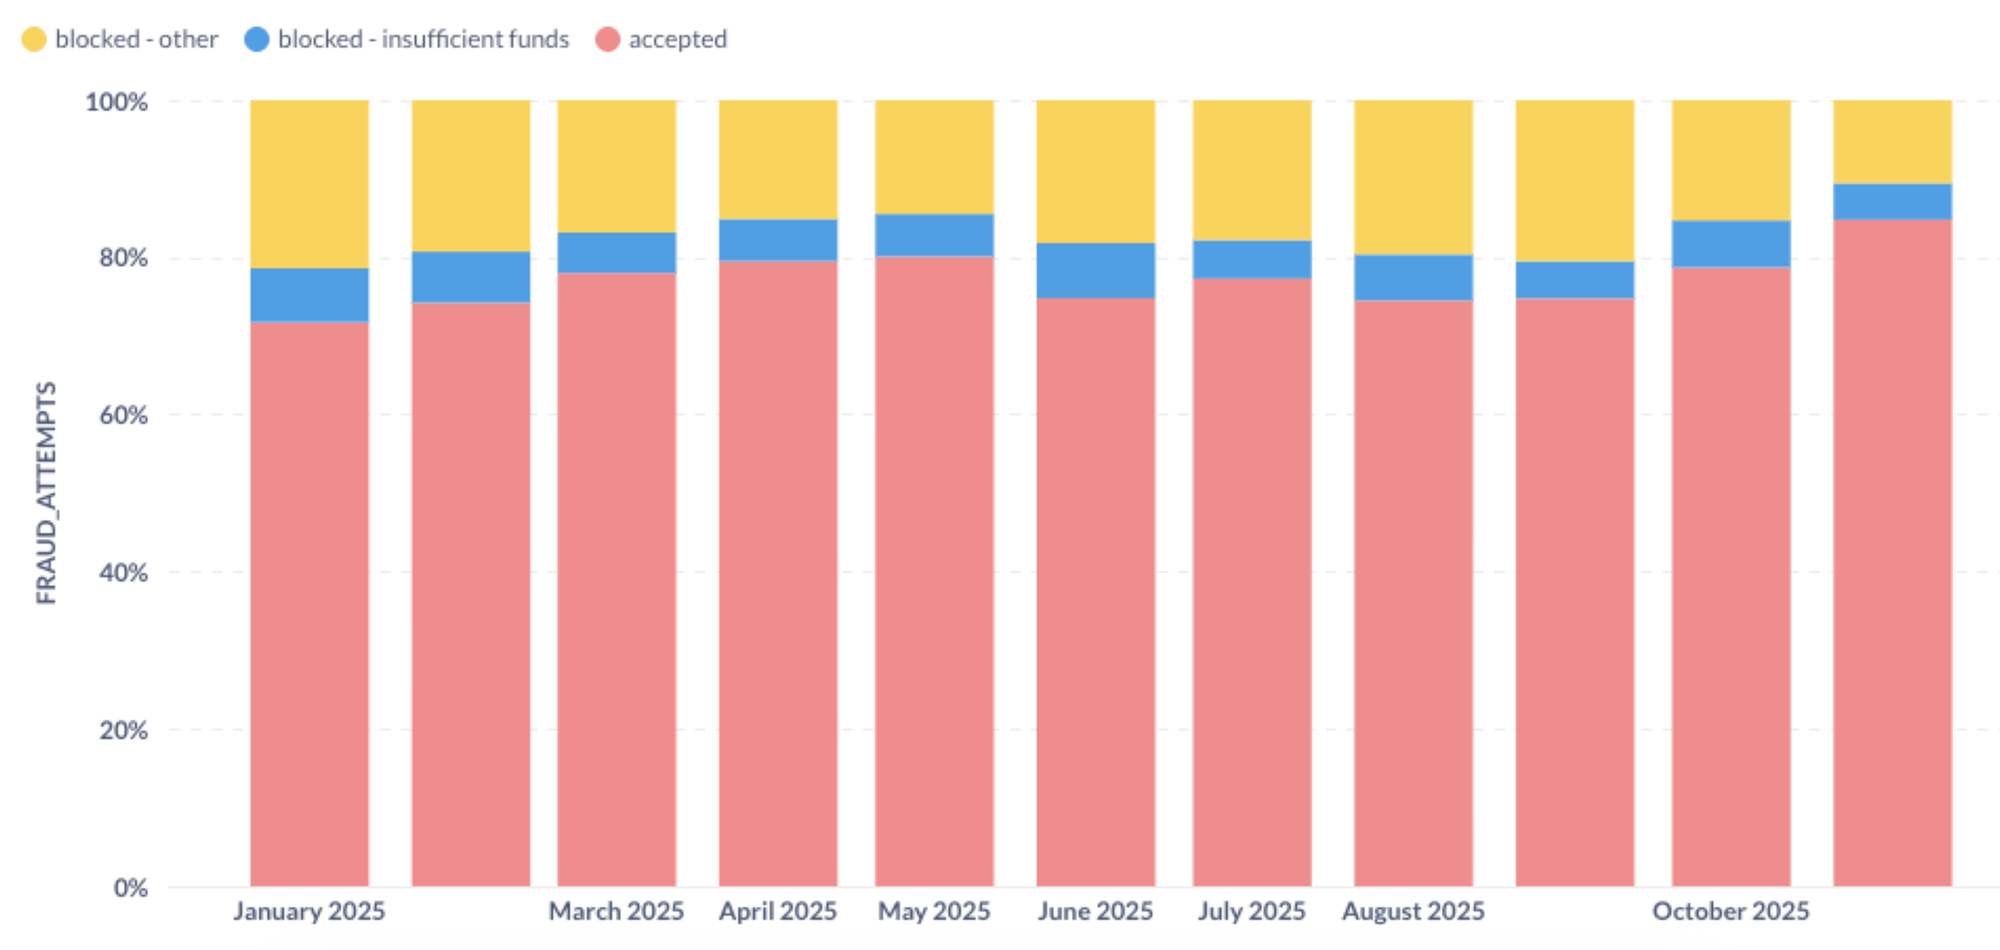
Interestingly, there were similar decreases in accepted fraudulent transactions and those blocked for insufficient balances. This implies that programmatic fraud is not taking place without balance checking in advance. If thieves attempted fraudulent transactions on users’ typical deposit dates, one would expect a higher-than-normal volume of transactions blocked because of insufficient balances.
Maryland#maryland
Maryland saw a small month over month increase in theft rate. While the geographical pattern doesn’t imply a statewide data compromise (not all counties are elevated), there are few medium- or high-volume identifiable skimmers. Only 28% of Maryland users liquidated in November shopped at a retailer with a 15%+ future liquidation victim rate.
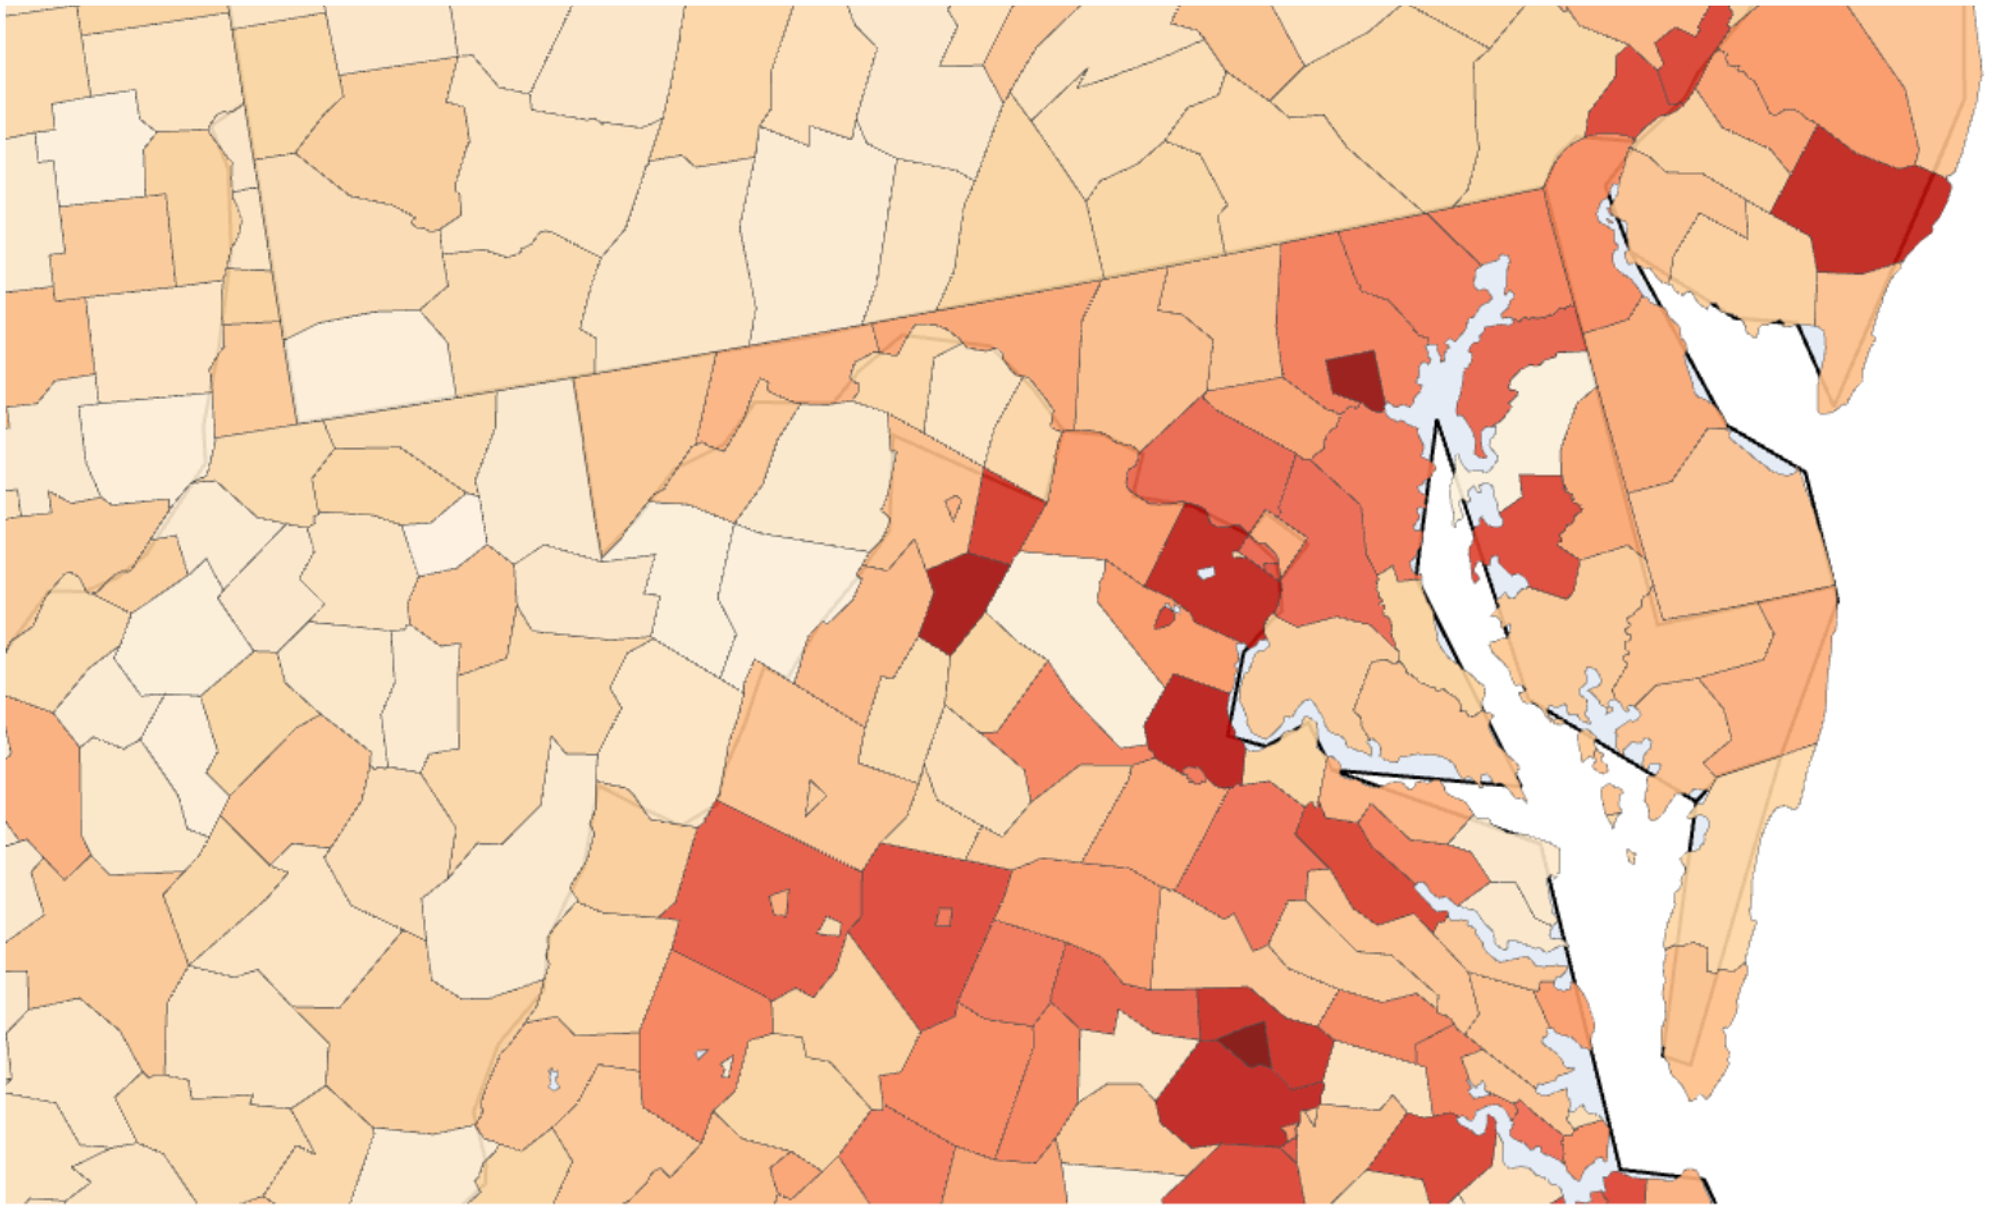
Note that Fairfax County in Northern Virginia also had elevated theft rates and border Maryland counties, but no skimmers in Fairfax County could be identified.
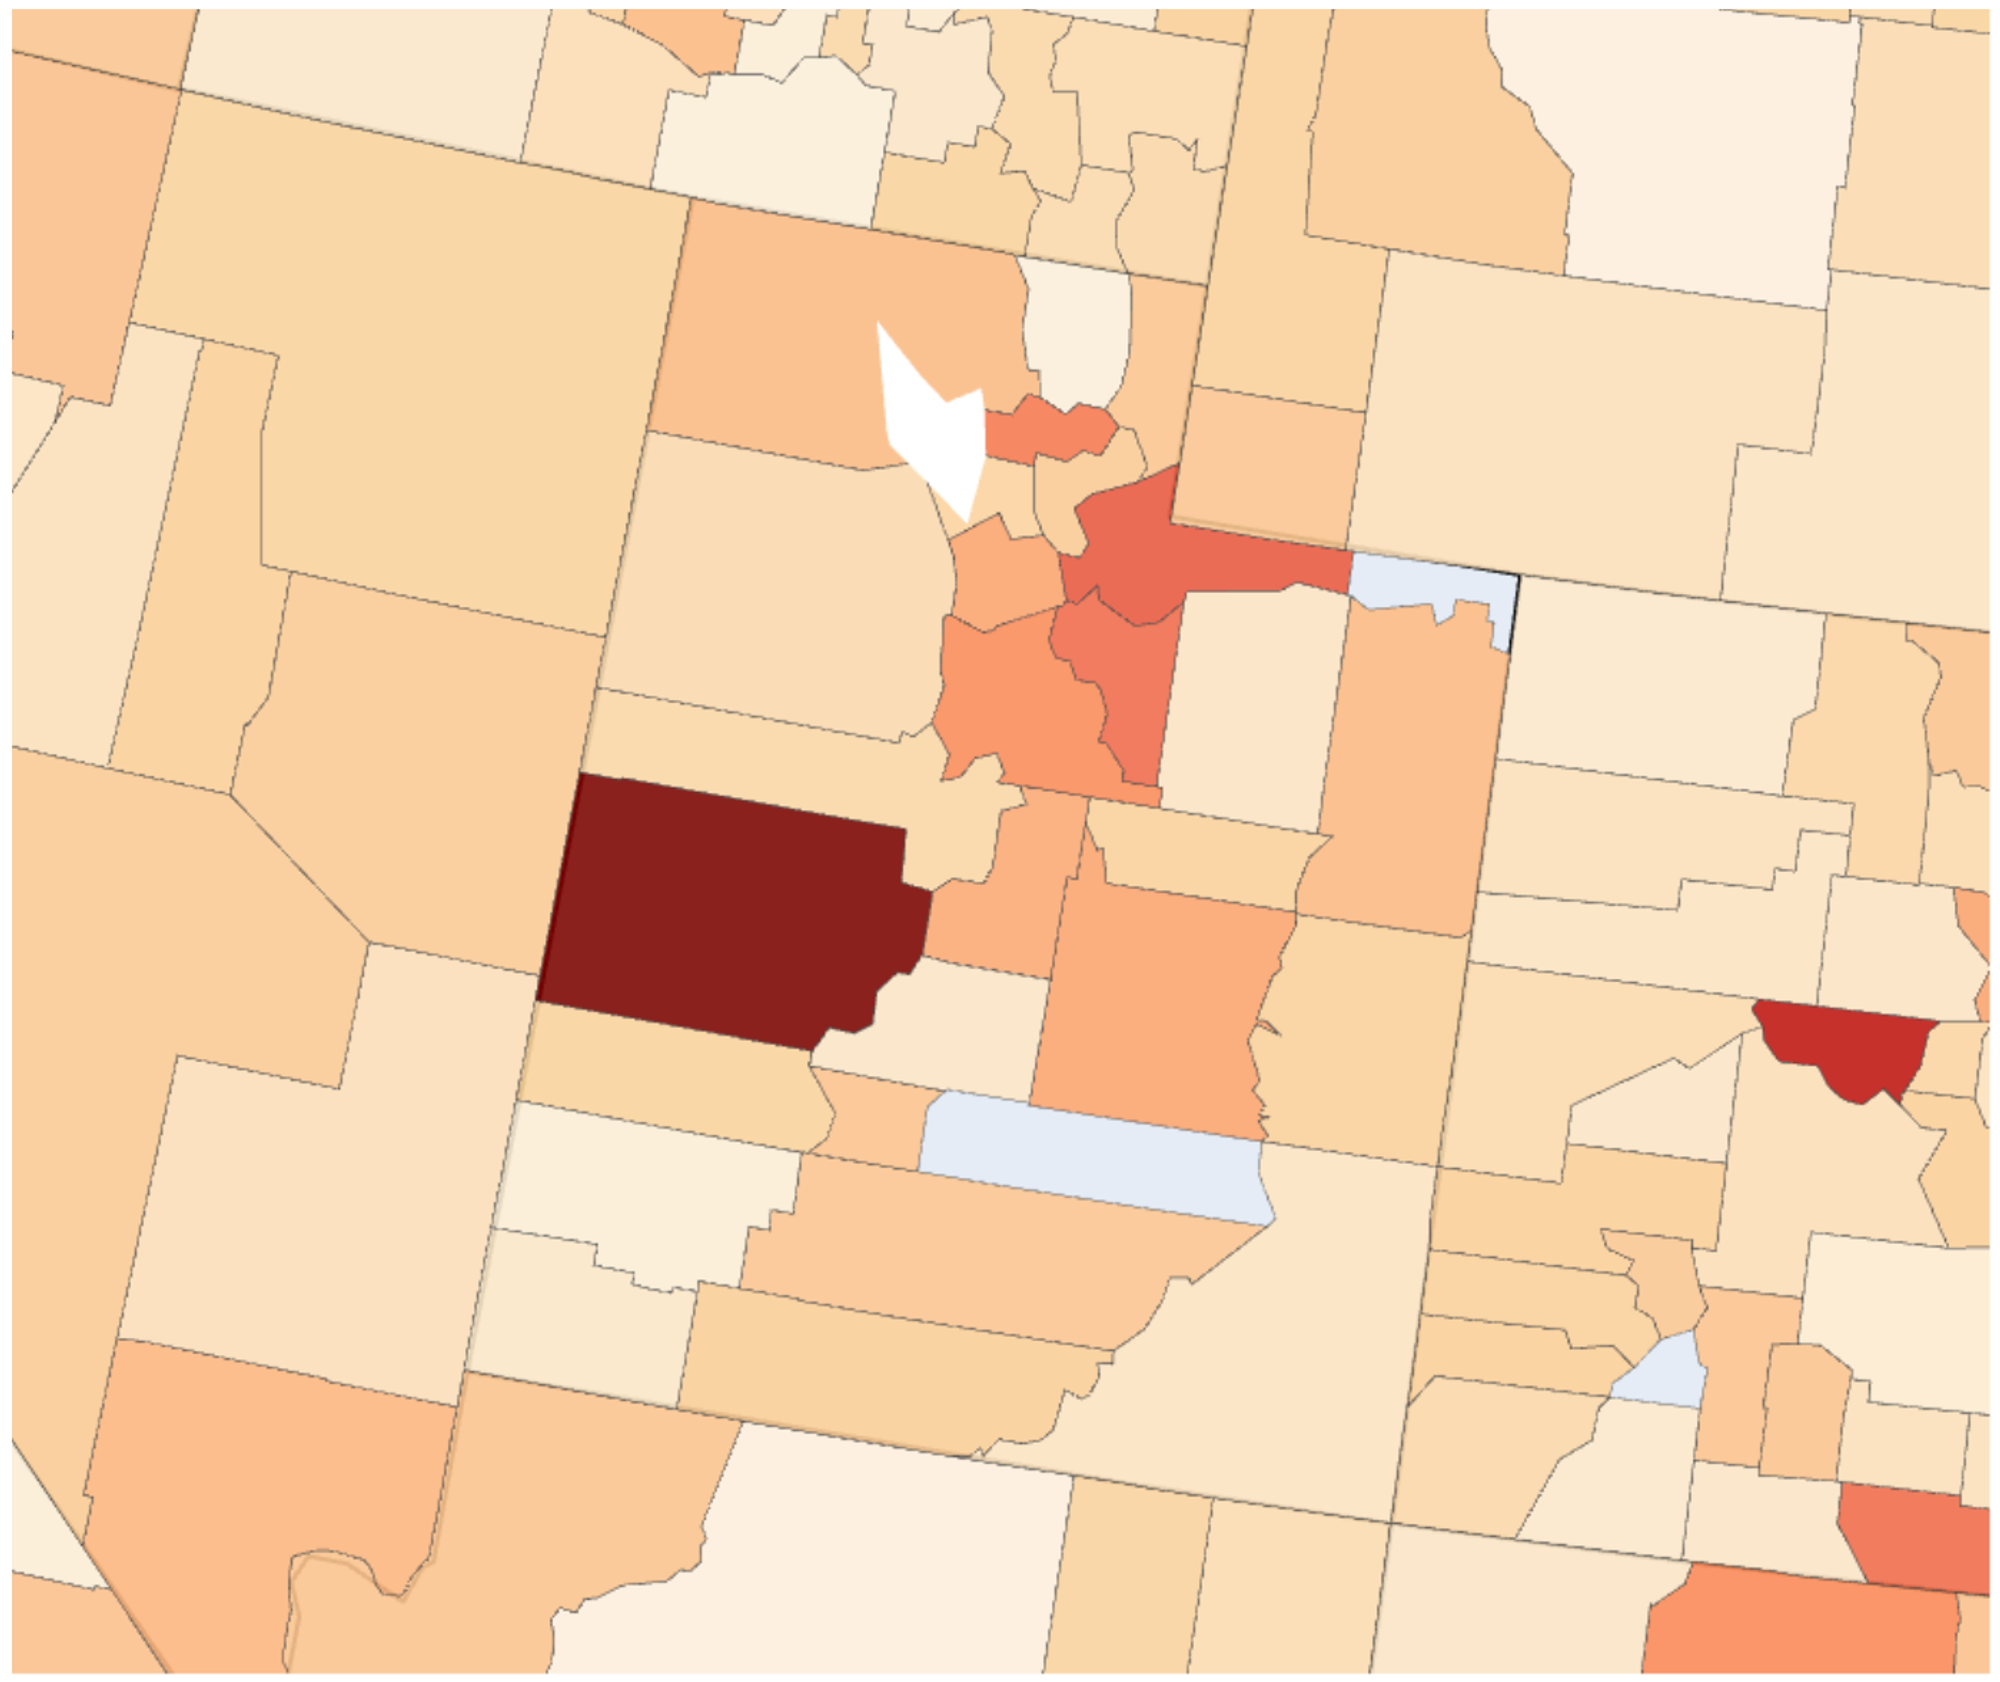
Utah#utah
Like Maryland, Utah’s theft doesn’t seem attributable to a statewide compromise. There are no identifiable skimmers in the state, so the source of theft is unclear. Millard County (on the western border) has a very high theft rate but a very low population, so it’s not a major contributor to Utah’s overall elevated theft rate.
Mississippi#mississippi
In November, Mississippi saw a similar unrecognized tap rate as last month. Liquidation continued to take place primarily at retailers with listed locations in Brooklyn and Philadelphia (though these could be thieves in other locations using fraudulently duplicated FNS numbers to pose as real retailers).
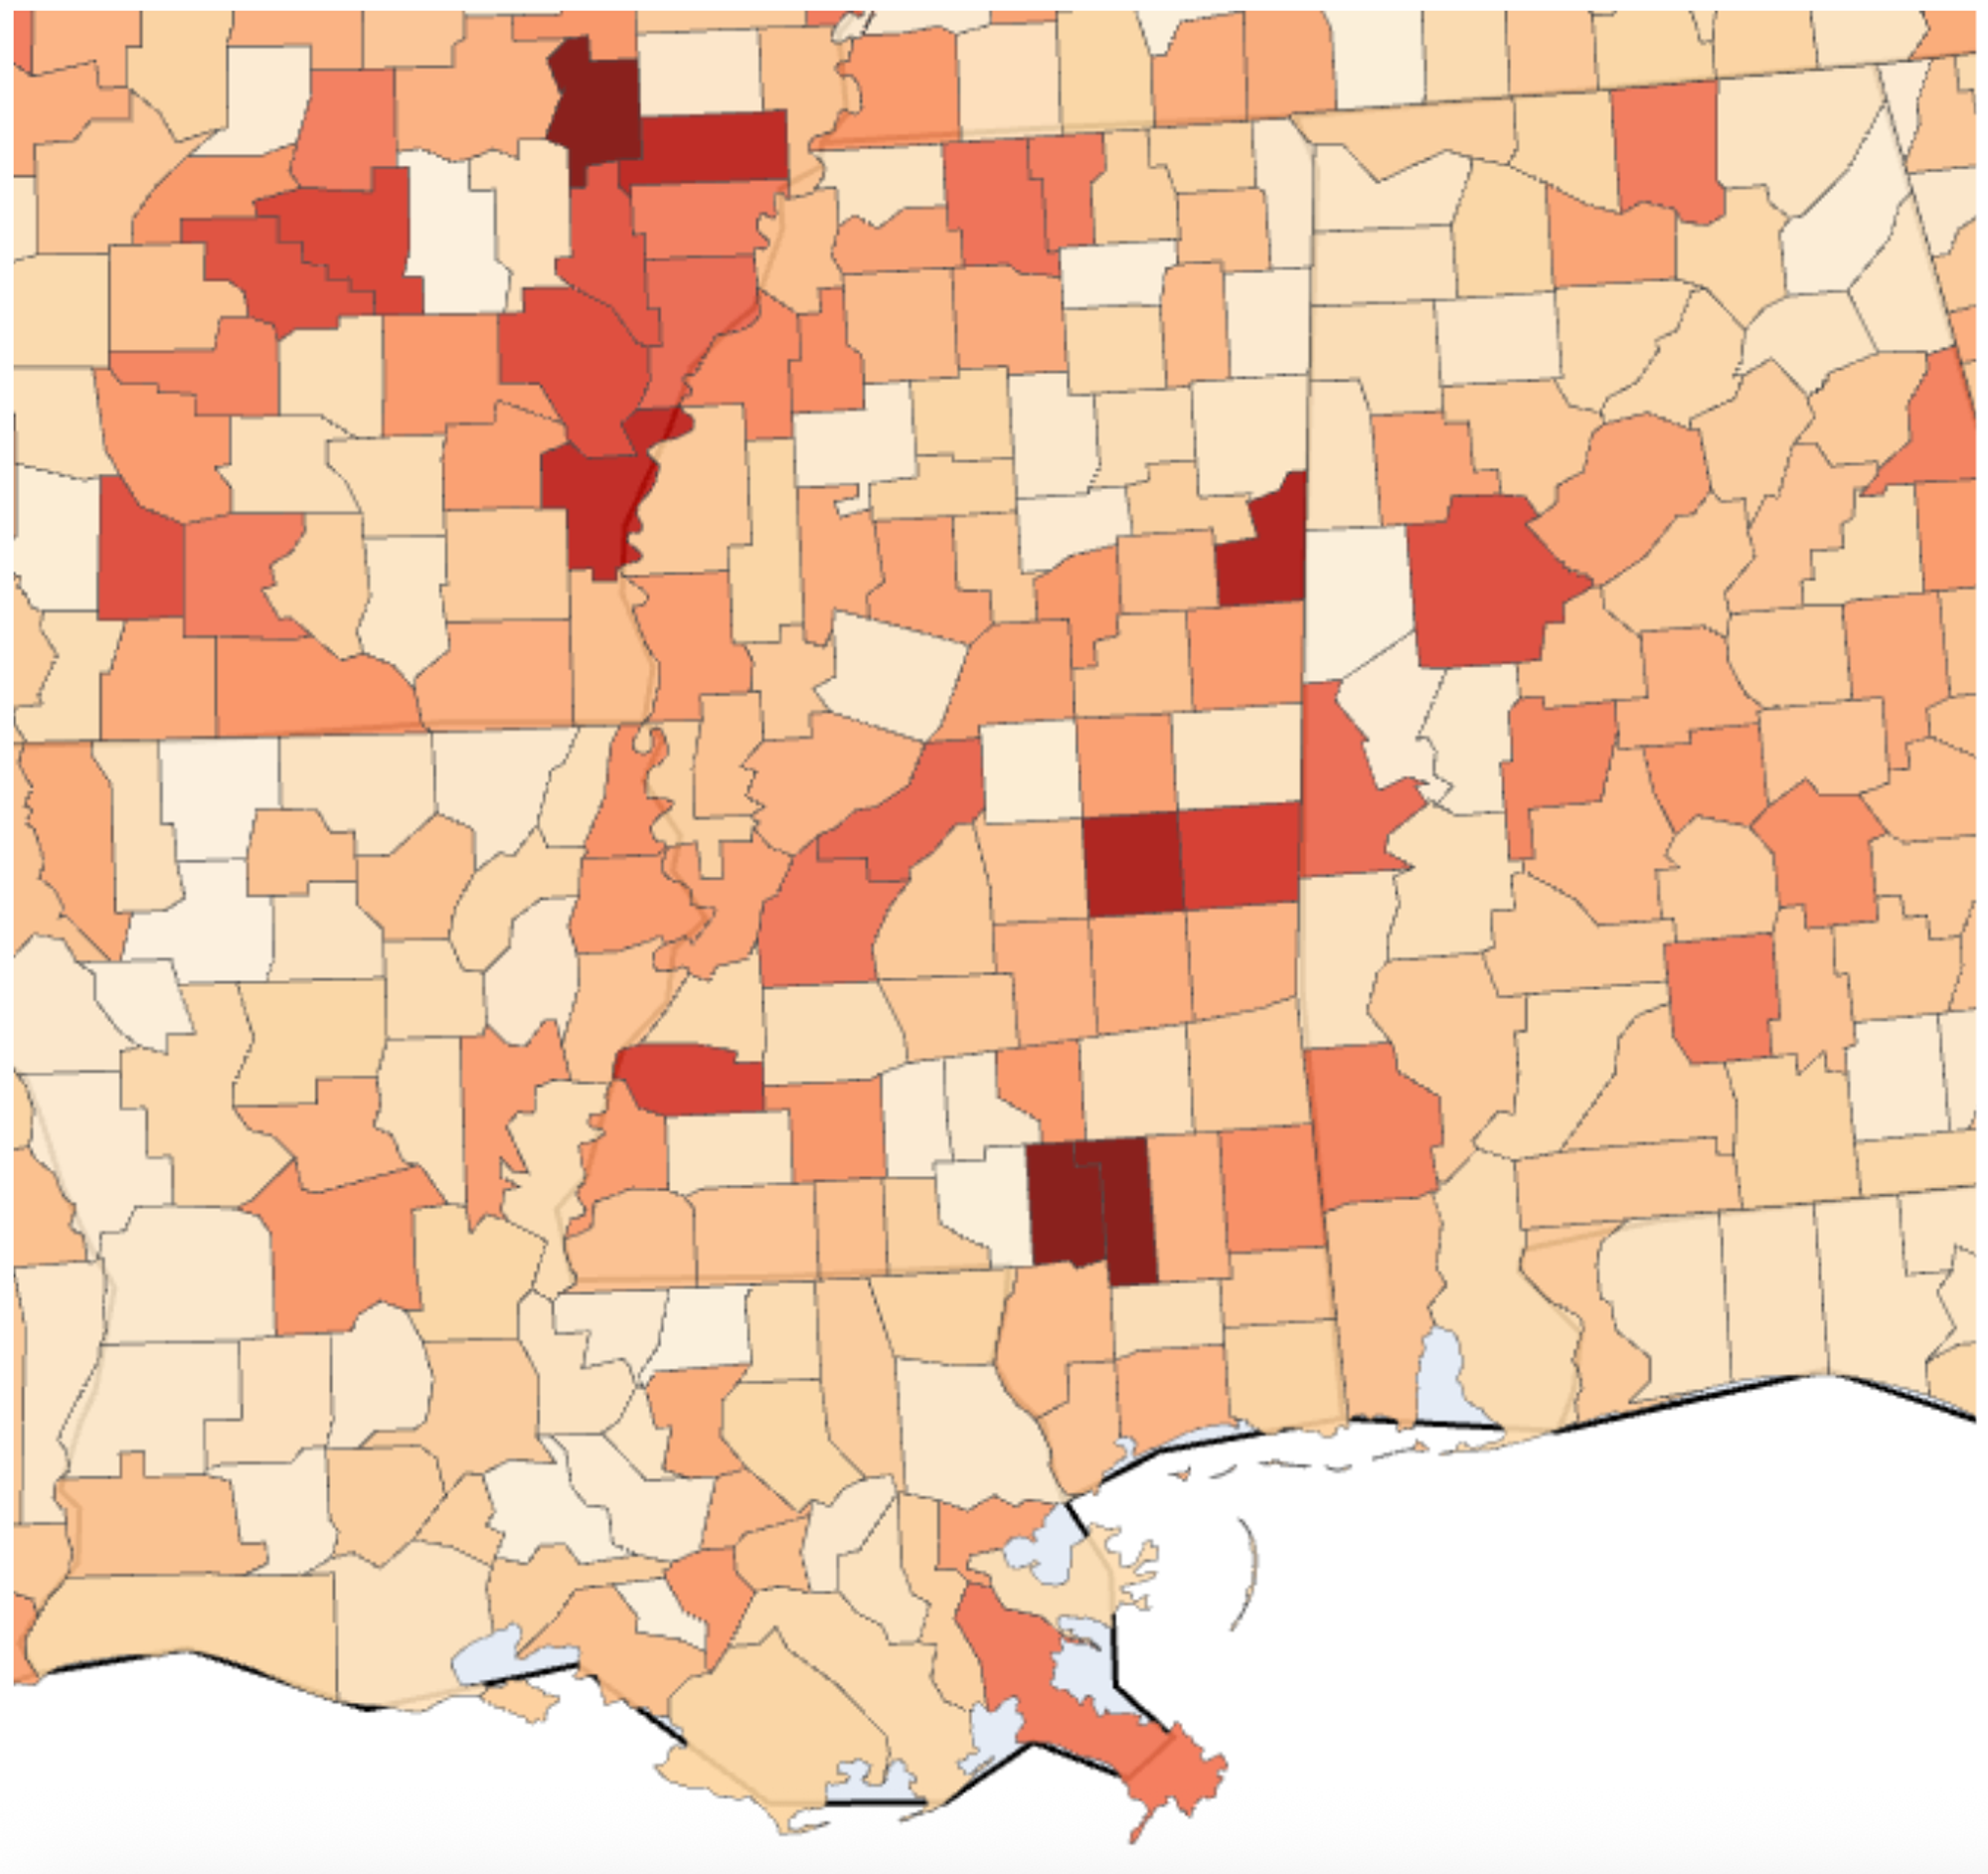
Similar to what was noted in last month’s report, there are still liquidations happening to cardholders skimmed at various retailer stores, though the volume is much lower than it was over the summer.
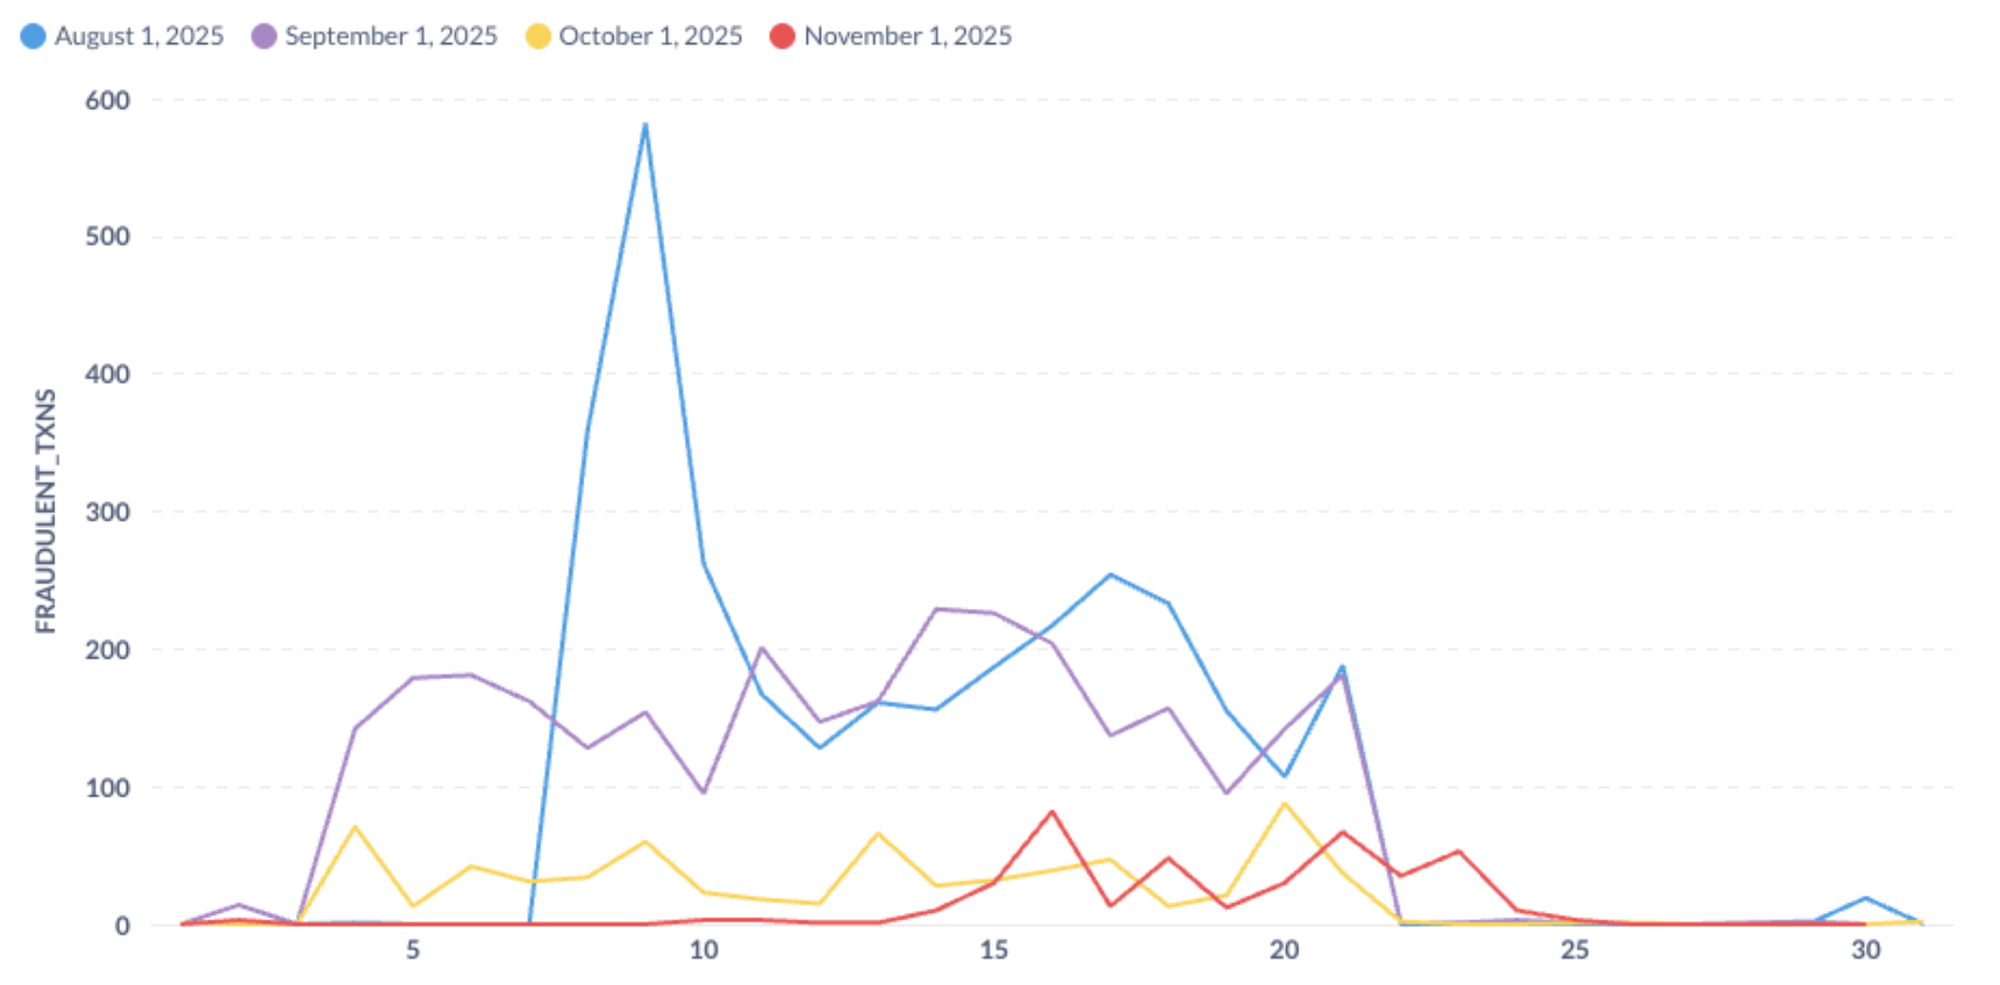
In line with the national trend, theft didn’t pick up until later in the month when deposits became available. In Mississippi, cardholders didn’t begin receiving partial deposits until the 10th – full deposits weren’t completed until the 21st (as opposed to the typical schedule of even distributions the 4th through 21st). The chart below shows the delay in theft in November as well as the reduction in theft each month since its peak in August.
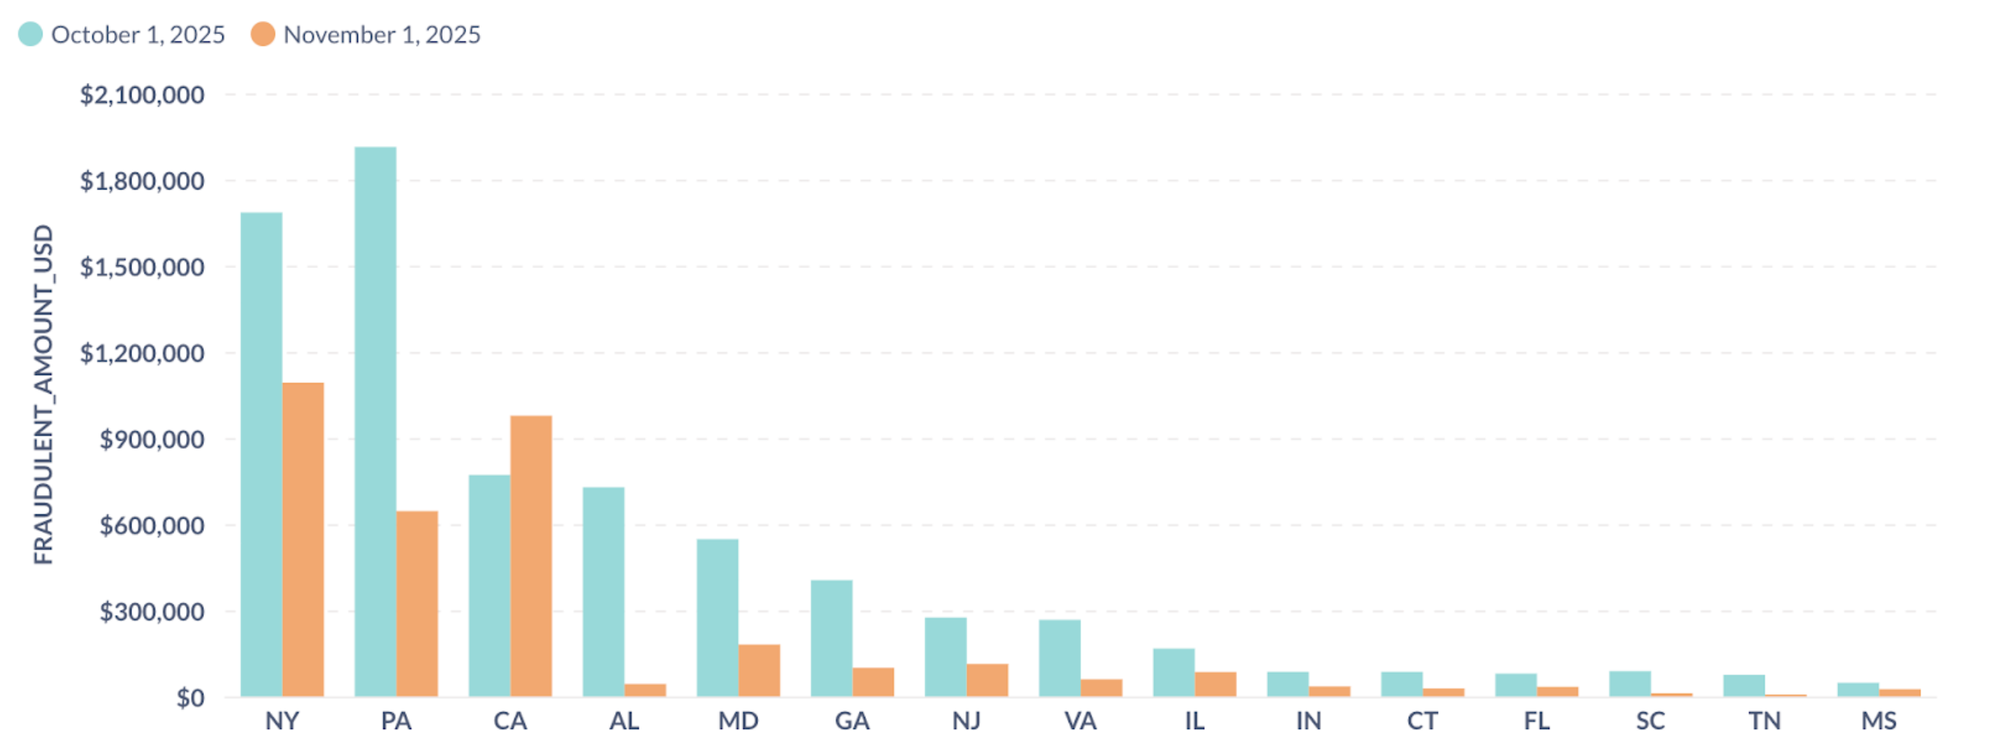
California#california
California is the only state that saw a volume increase in fraudulent spending. 99% of California theft in November was cash benefits theft (as opposed to SNAP). Despite the increase, November cash fraud volume ($1.2M) was still much lower than its high in January ($5.0M). Additionally, California’s unrecognized transaction rate was in the lower half of states this month.
Ongoing support#ongoing-support
Propel is committed to supporting state and federal agencies in protecting SNAP recipients from EBT theft. For questions about our methodology or further analysis, please contact gov@joinpropel.com.