Data insights: February 2026 EBT theft trends
Our editorial promise
All of our Propel editorial content meets our high bar for accuracy, timeliness, trust, and relevance. Our pages are edited and fact-checked to make sure we meet our mission of giving you information you can rely on.
Learn more about our editorial standards.
Return to Propel's EBT Theft Hub
Key findings#key-findings
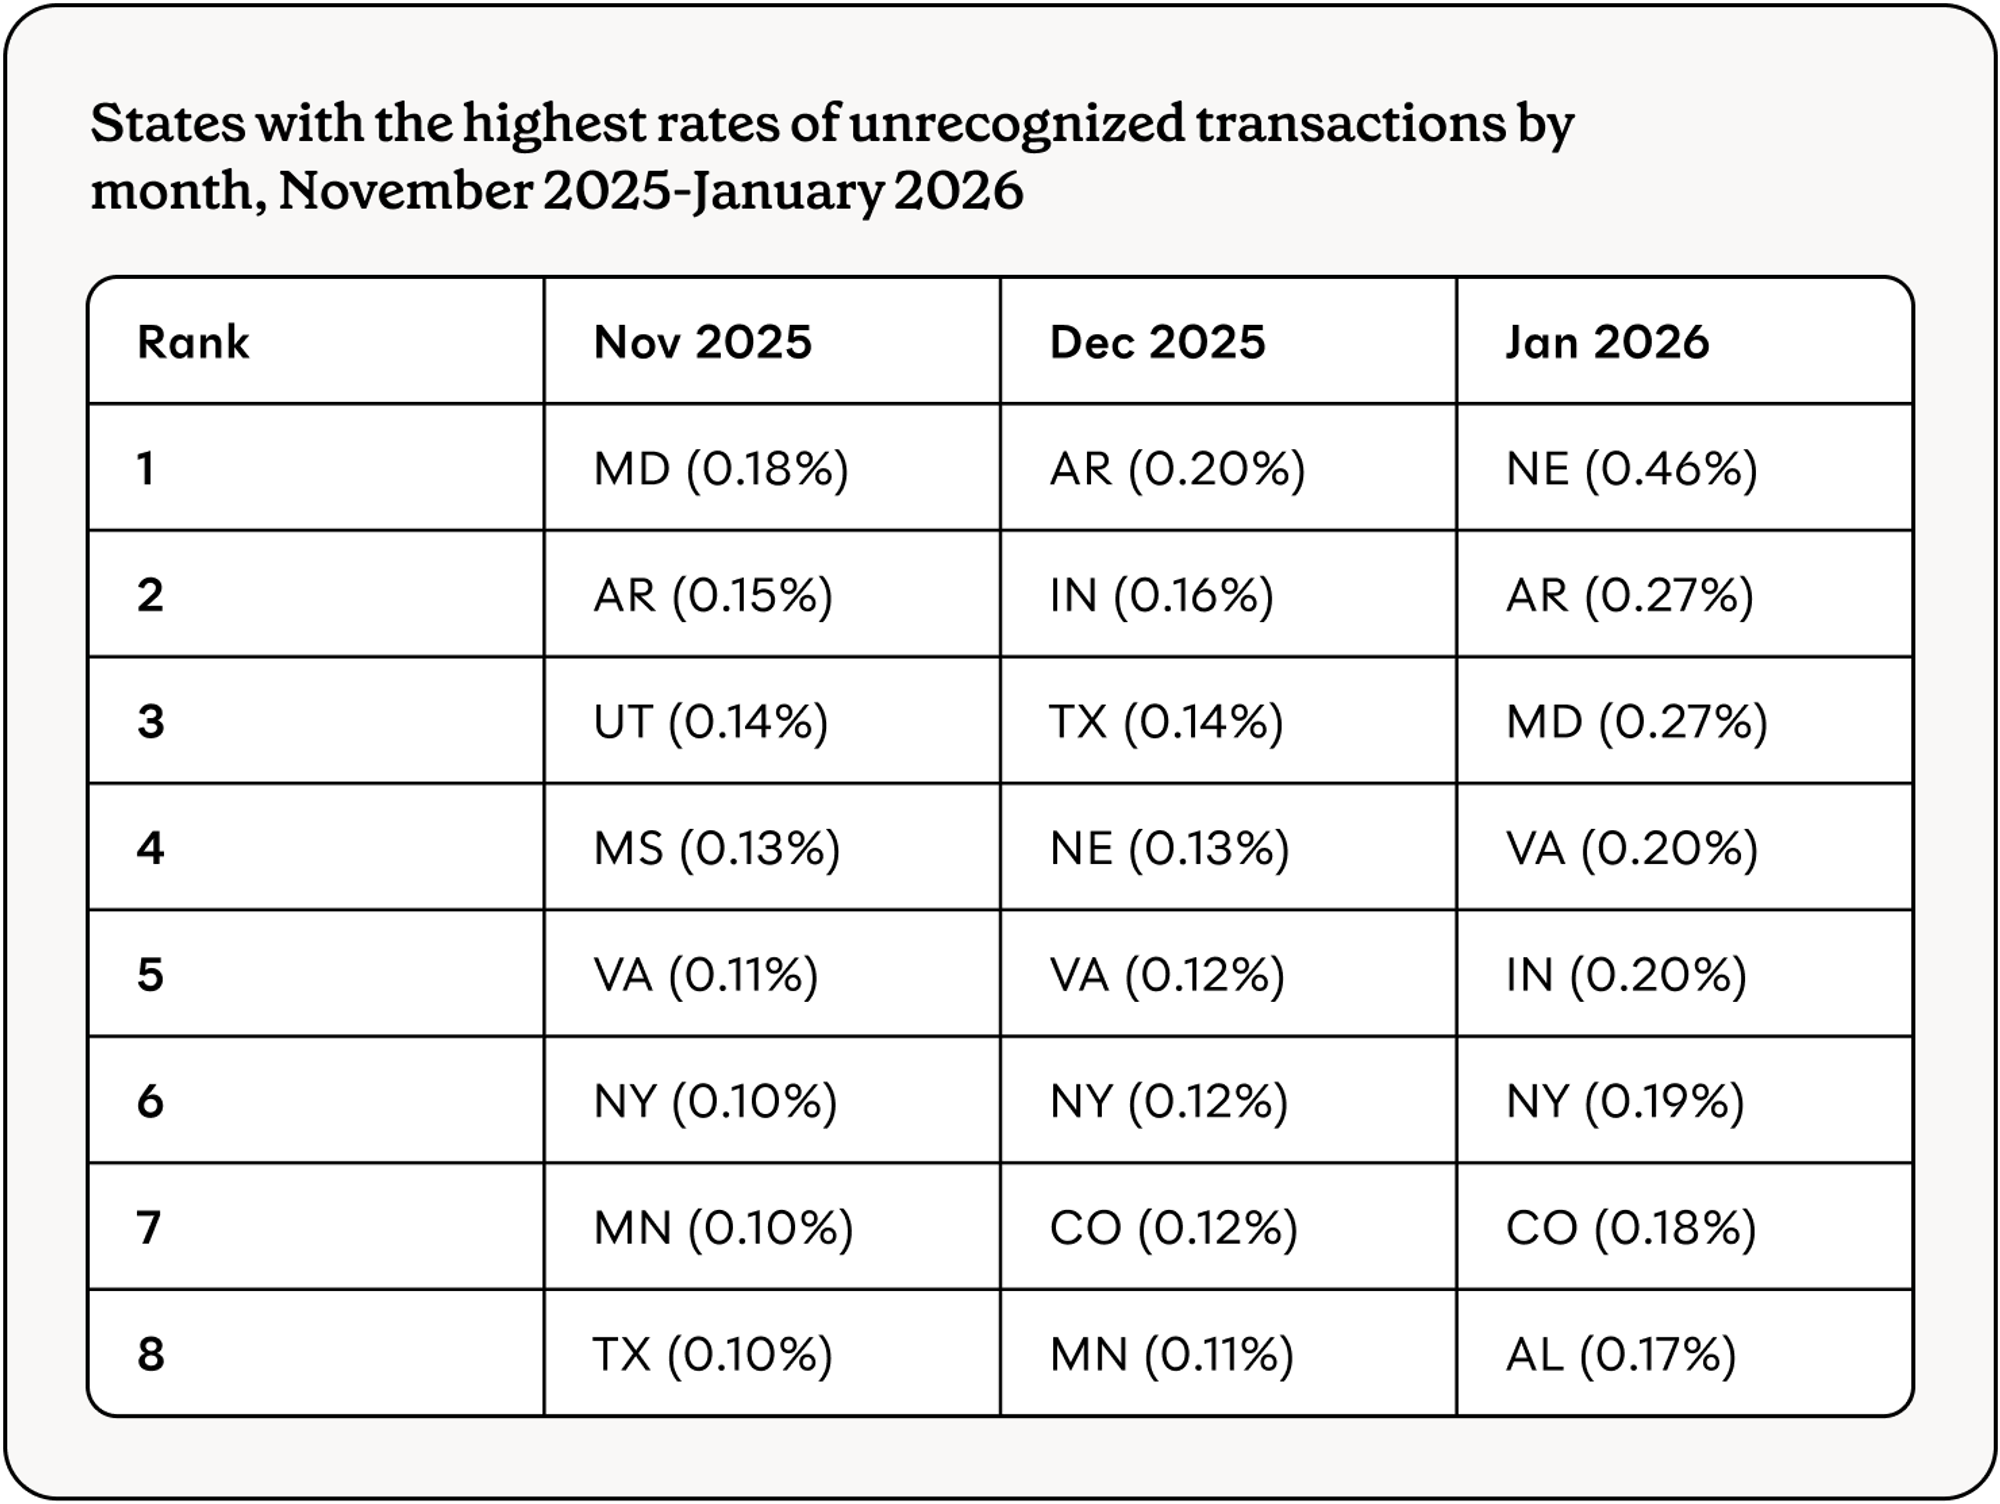
- Multiple states saw increases in theft from December to January, with many of these increases continuing into February
- Nebraska had the highest theft rate in January, reaching unprecedented levels in the state; however, limited retailer data in the state prevents deeper analysis
- Virginia and Maryland saw elevated theft driven by skimmers at specific retail locations
- Arkansas and Indiana continue to see elevated theft rates
Propel’s theft detection capabilities#propels-theft-detection-capabilities
Propel serves over 5 million EBT cardholders nationwide who use our app to manage their benefits every month. We analyze transaction and customer-reported data to identify emerging theft patterns through a two-step detection process. First, we identify retailers with unusually high rates of transactions flagged as "unrecognized" by Propel users. These are retailers where stolen benefits appear to be drained or liquidated. Second, we identify skimmer locations by analyzing victims’ shopping patterns in the 8-12 weeks prior to their card being liquidated.
Our insights are intended to provide a snapshot of emerging trends in EBT theft. We generate these analyses early in the month, when theft activity typically peaks following SNAP benefit deposits. Our data reflects real theft activity, but may show a slight upward bias since cardholders are more likely to check the app after experiencing theft. Given the rapidly evolving nature of EBT theft, our insights represent a current snapshot rather than a comprehensive assessment.
Recent theft patterns and spikes#recent-theft-patterns-and-spikes
Multiple states saw increases in theft from December to January, and many of these increases continued into February. Nebraska had the highest theft rate in January. Virginia and Maryland saw elevated theft driven by skimmers at specific retail locations. Arkansas and Indiana continue to see elevated theft.
Nebraska theft reached unprecedented levels in January#nebraska-theft-reached-unprecedented-levels-in-january
Nebraska saw a large increase in unrecognized transactions from December to January, which has continued into February. These transactions occurred early in the month, in line with Nebraska’s deposit schedule.
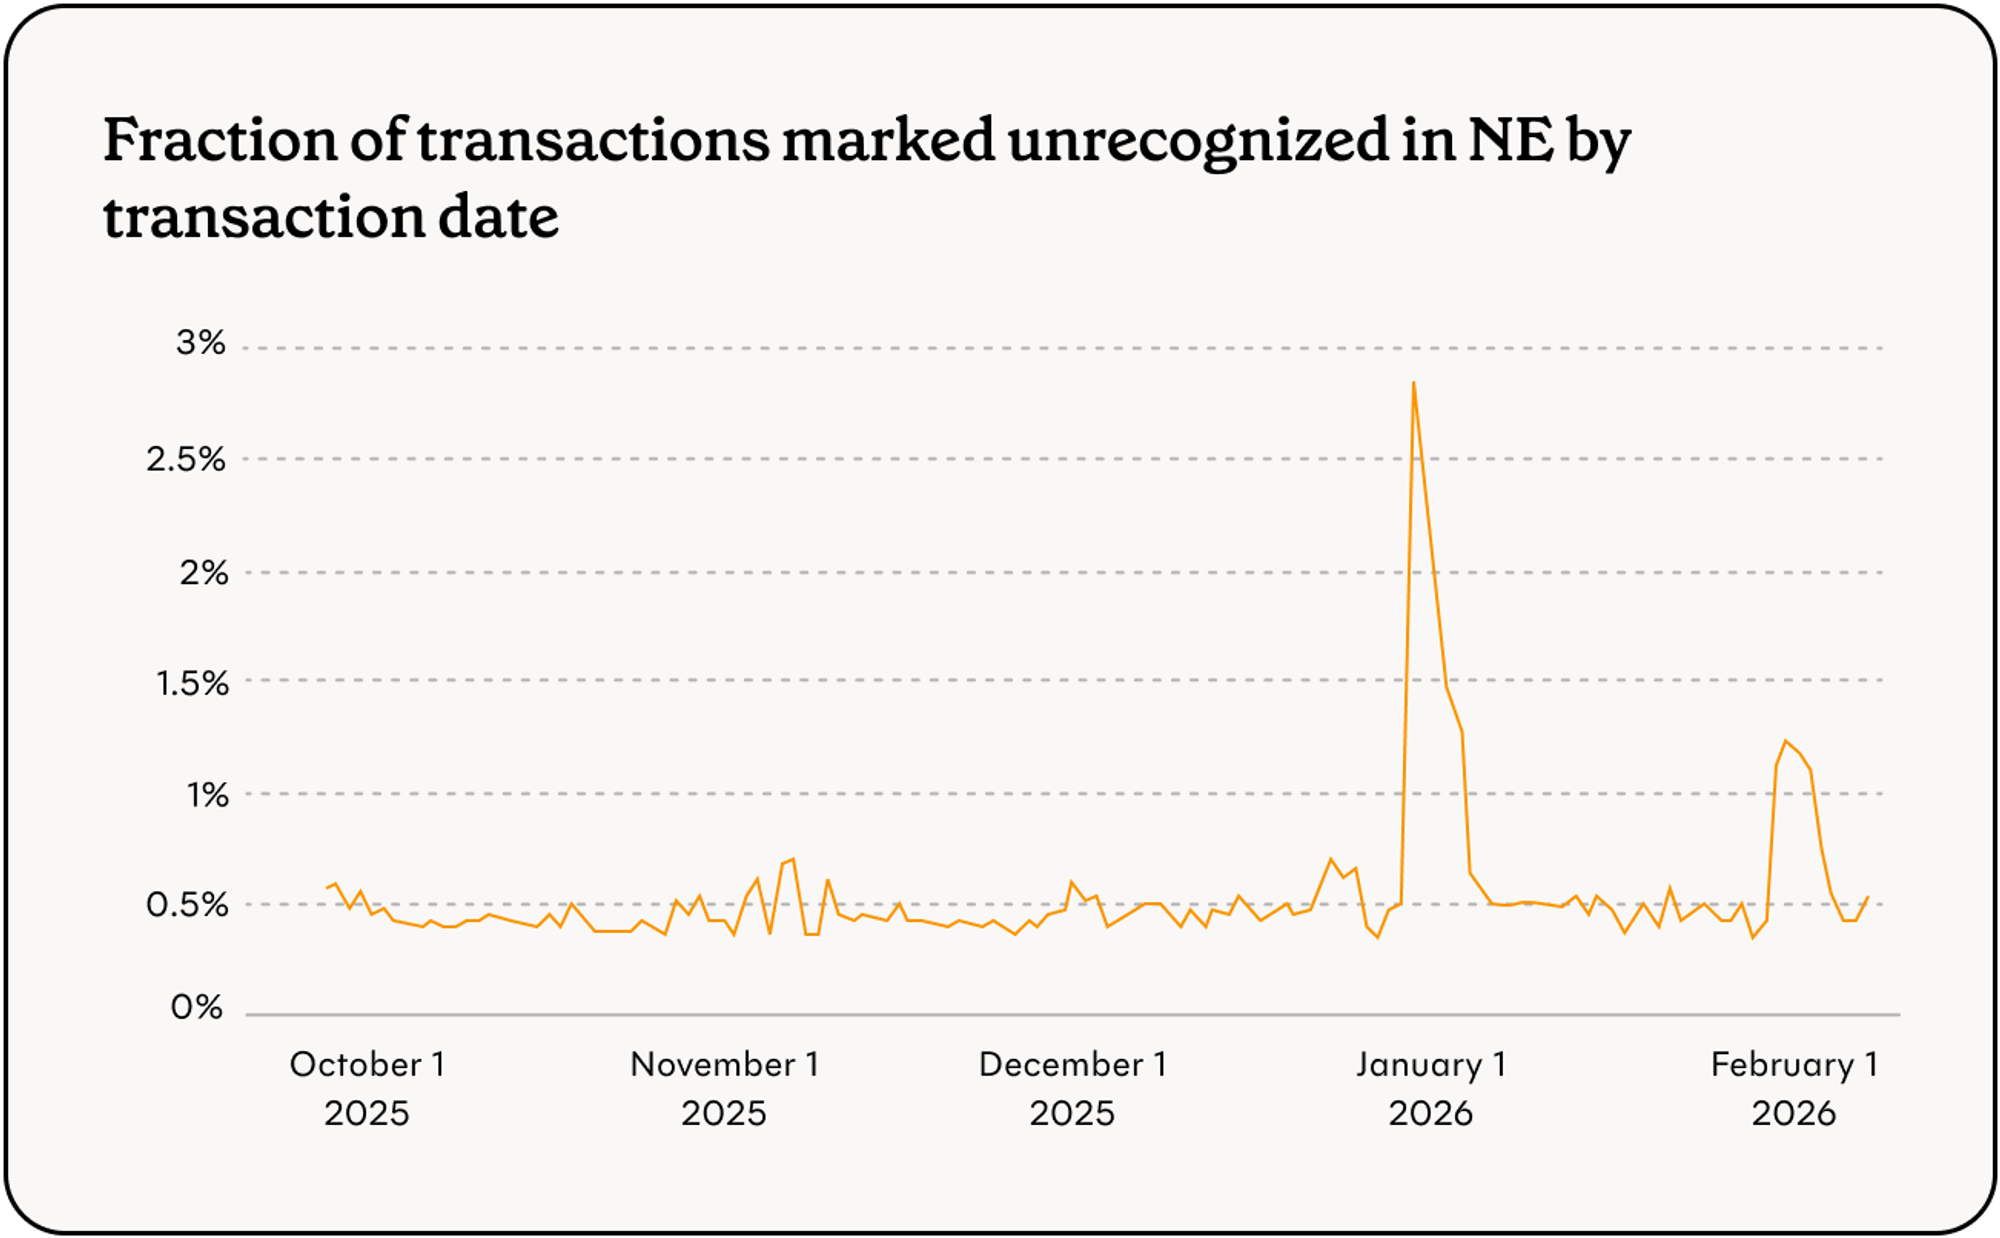
Unfortunately, Propel (and users) cannot see retailer names in Nebraska transaction history provided by the state’s online EBT portal. This makes it impossible to identify skimming and liquidation patterns through data aggregation, and impedes the ability of individual SNAP recipients to recognize and report theft.
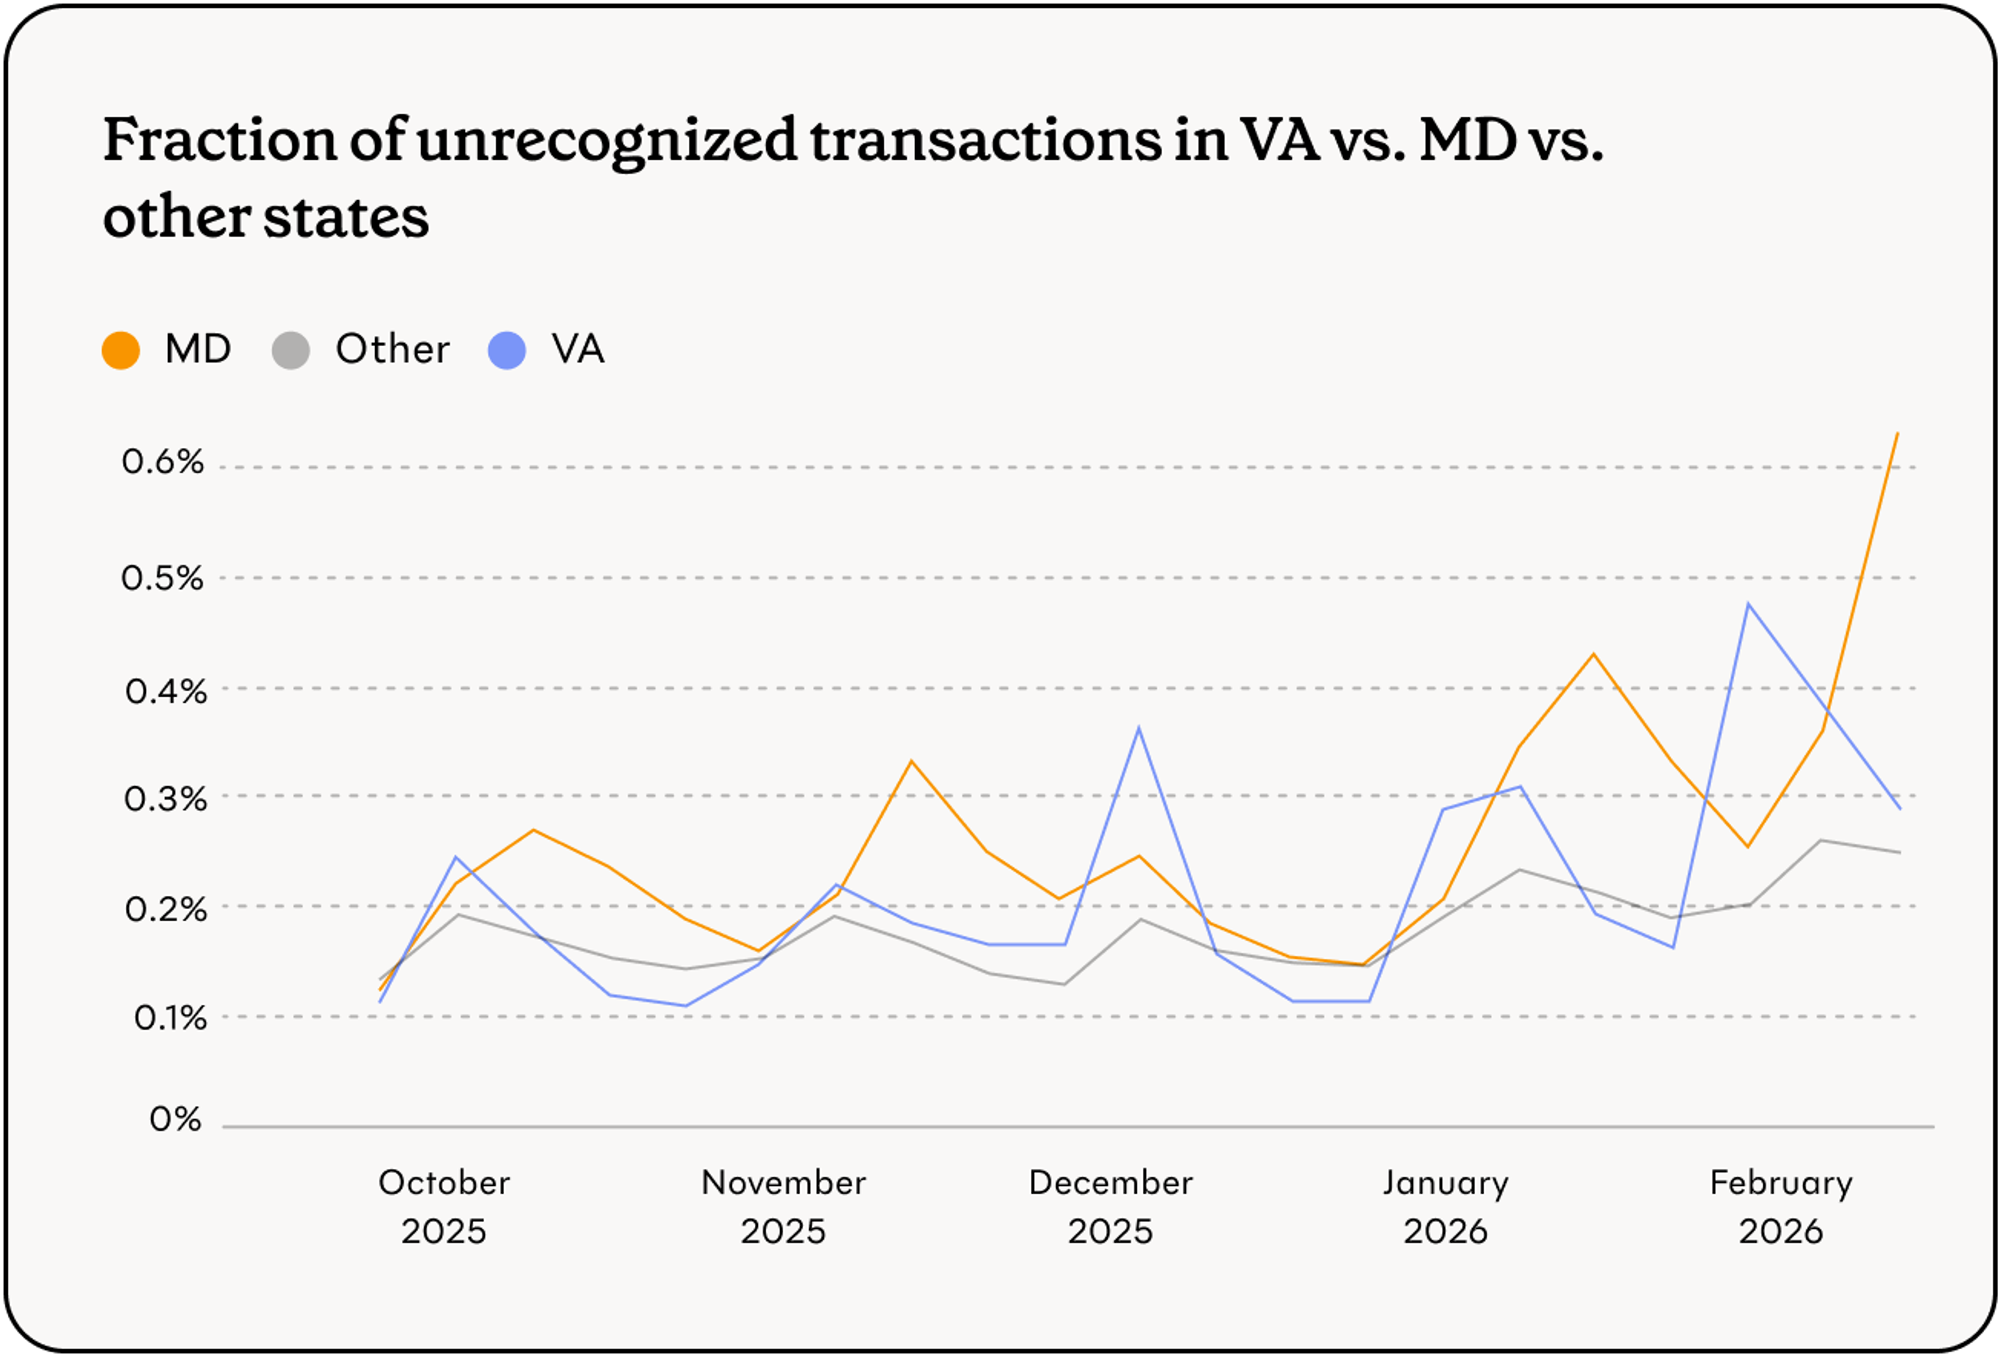
Maryland and Virginia skimming activity#maryland-and-virginia-skimming-activity
Theft in Maryland and Virginia increased sharply from December to January (and has continued into February).
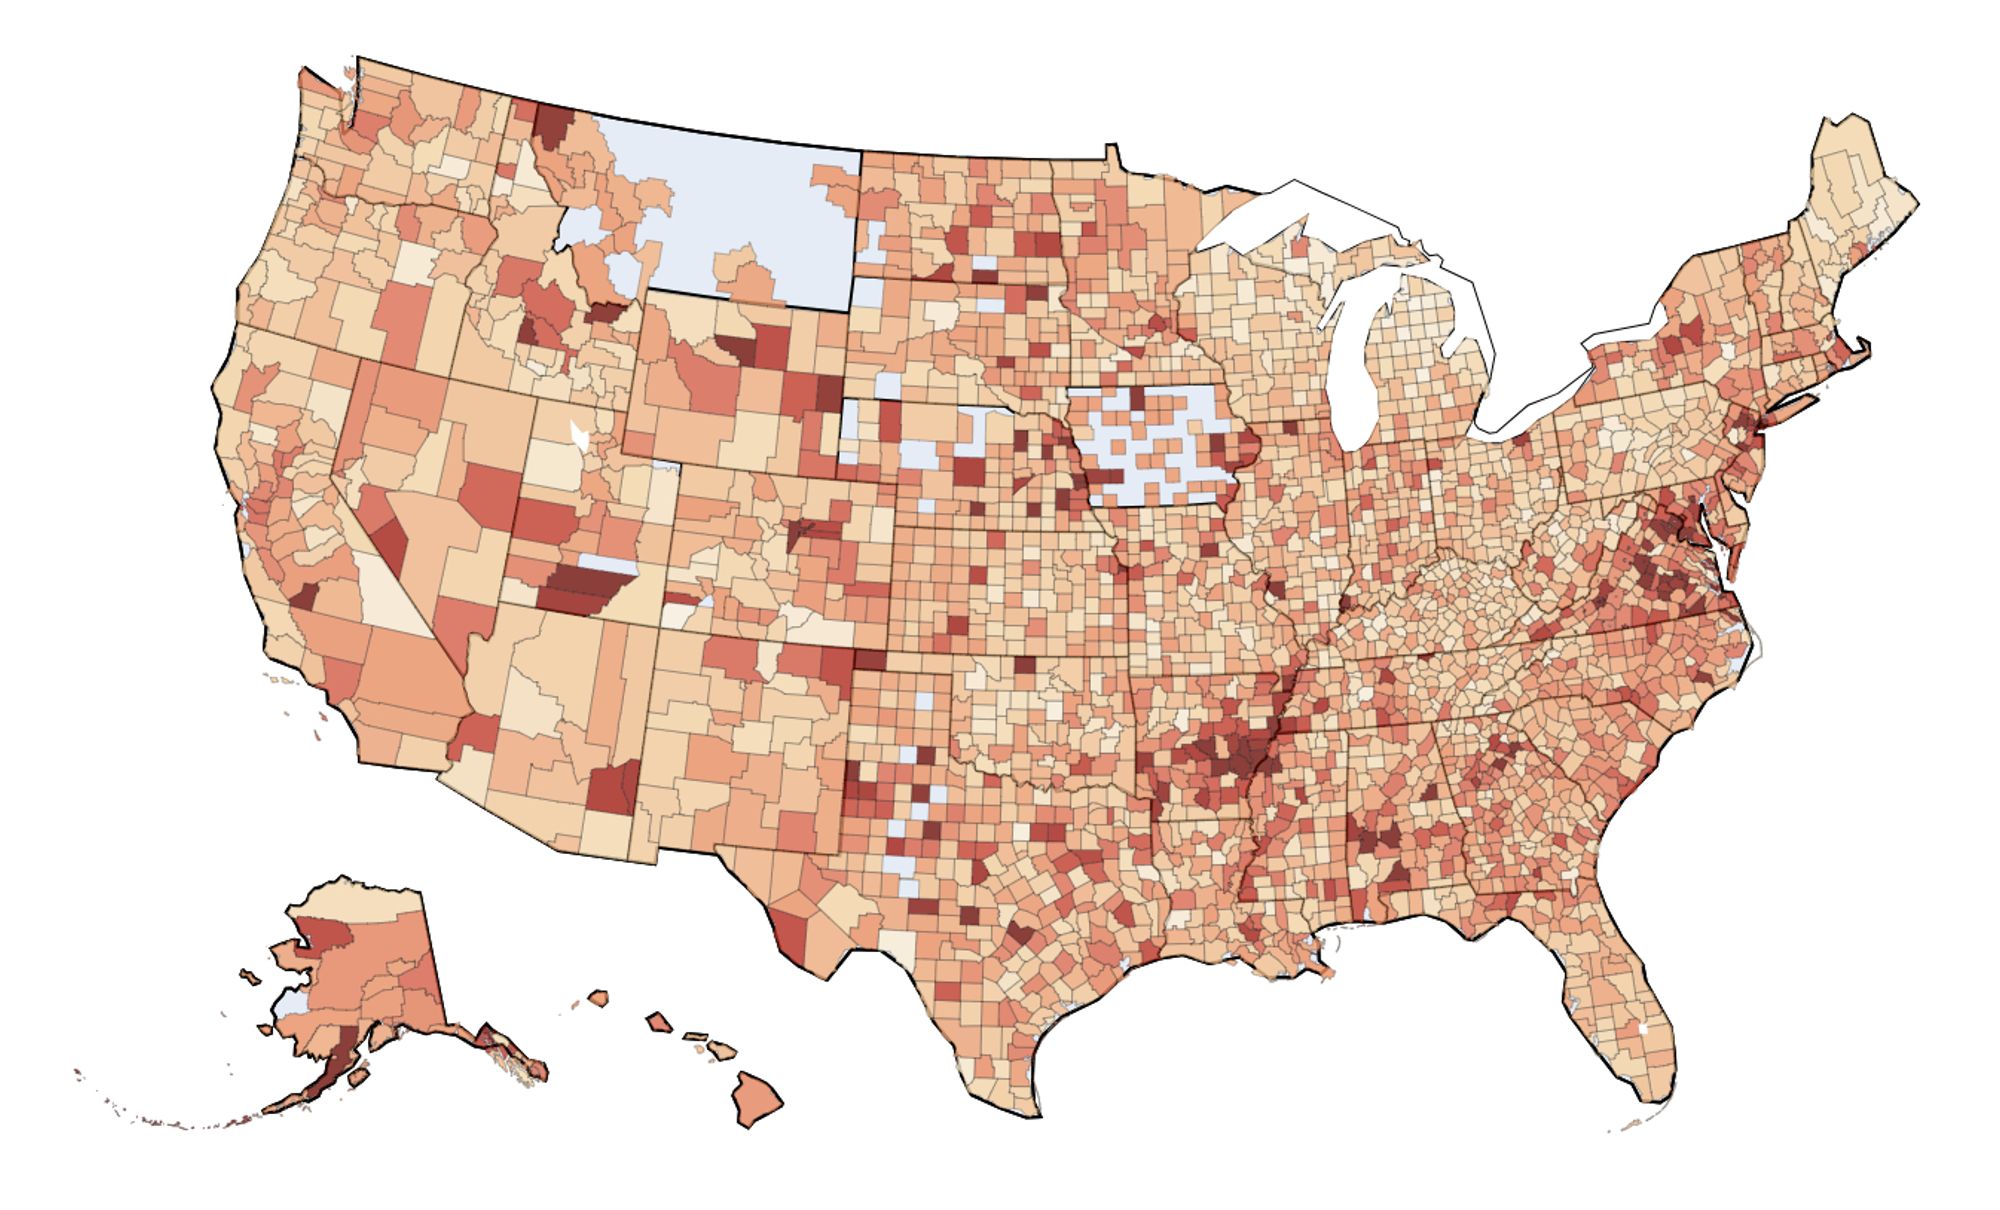
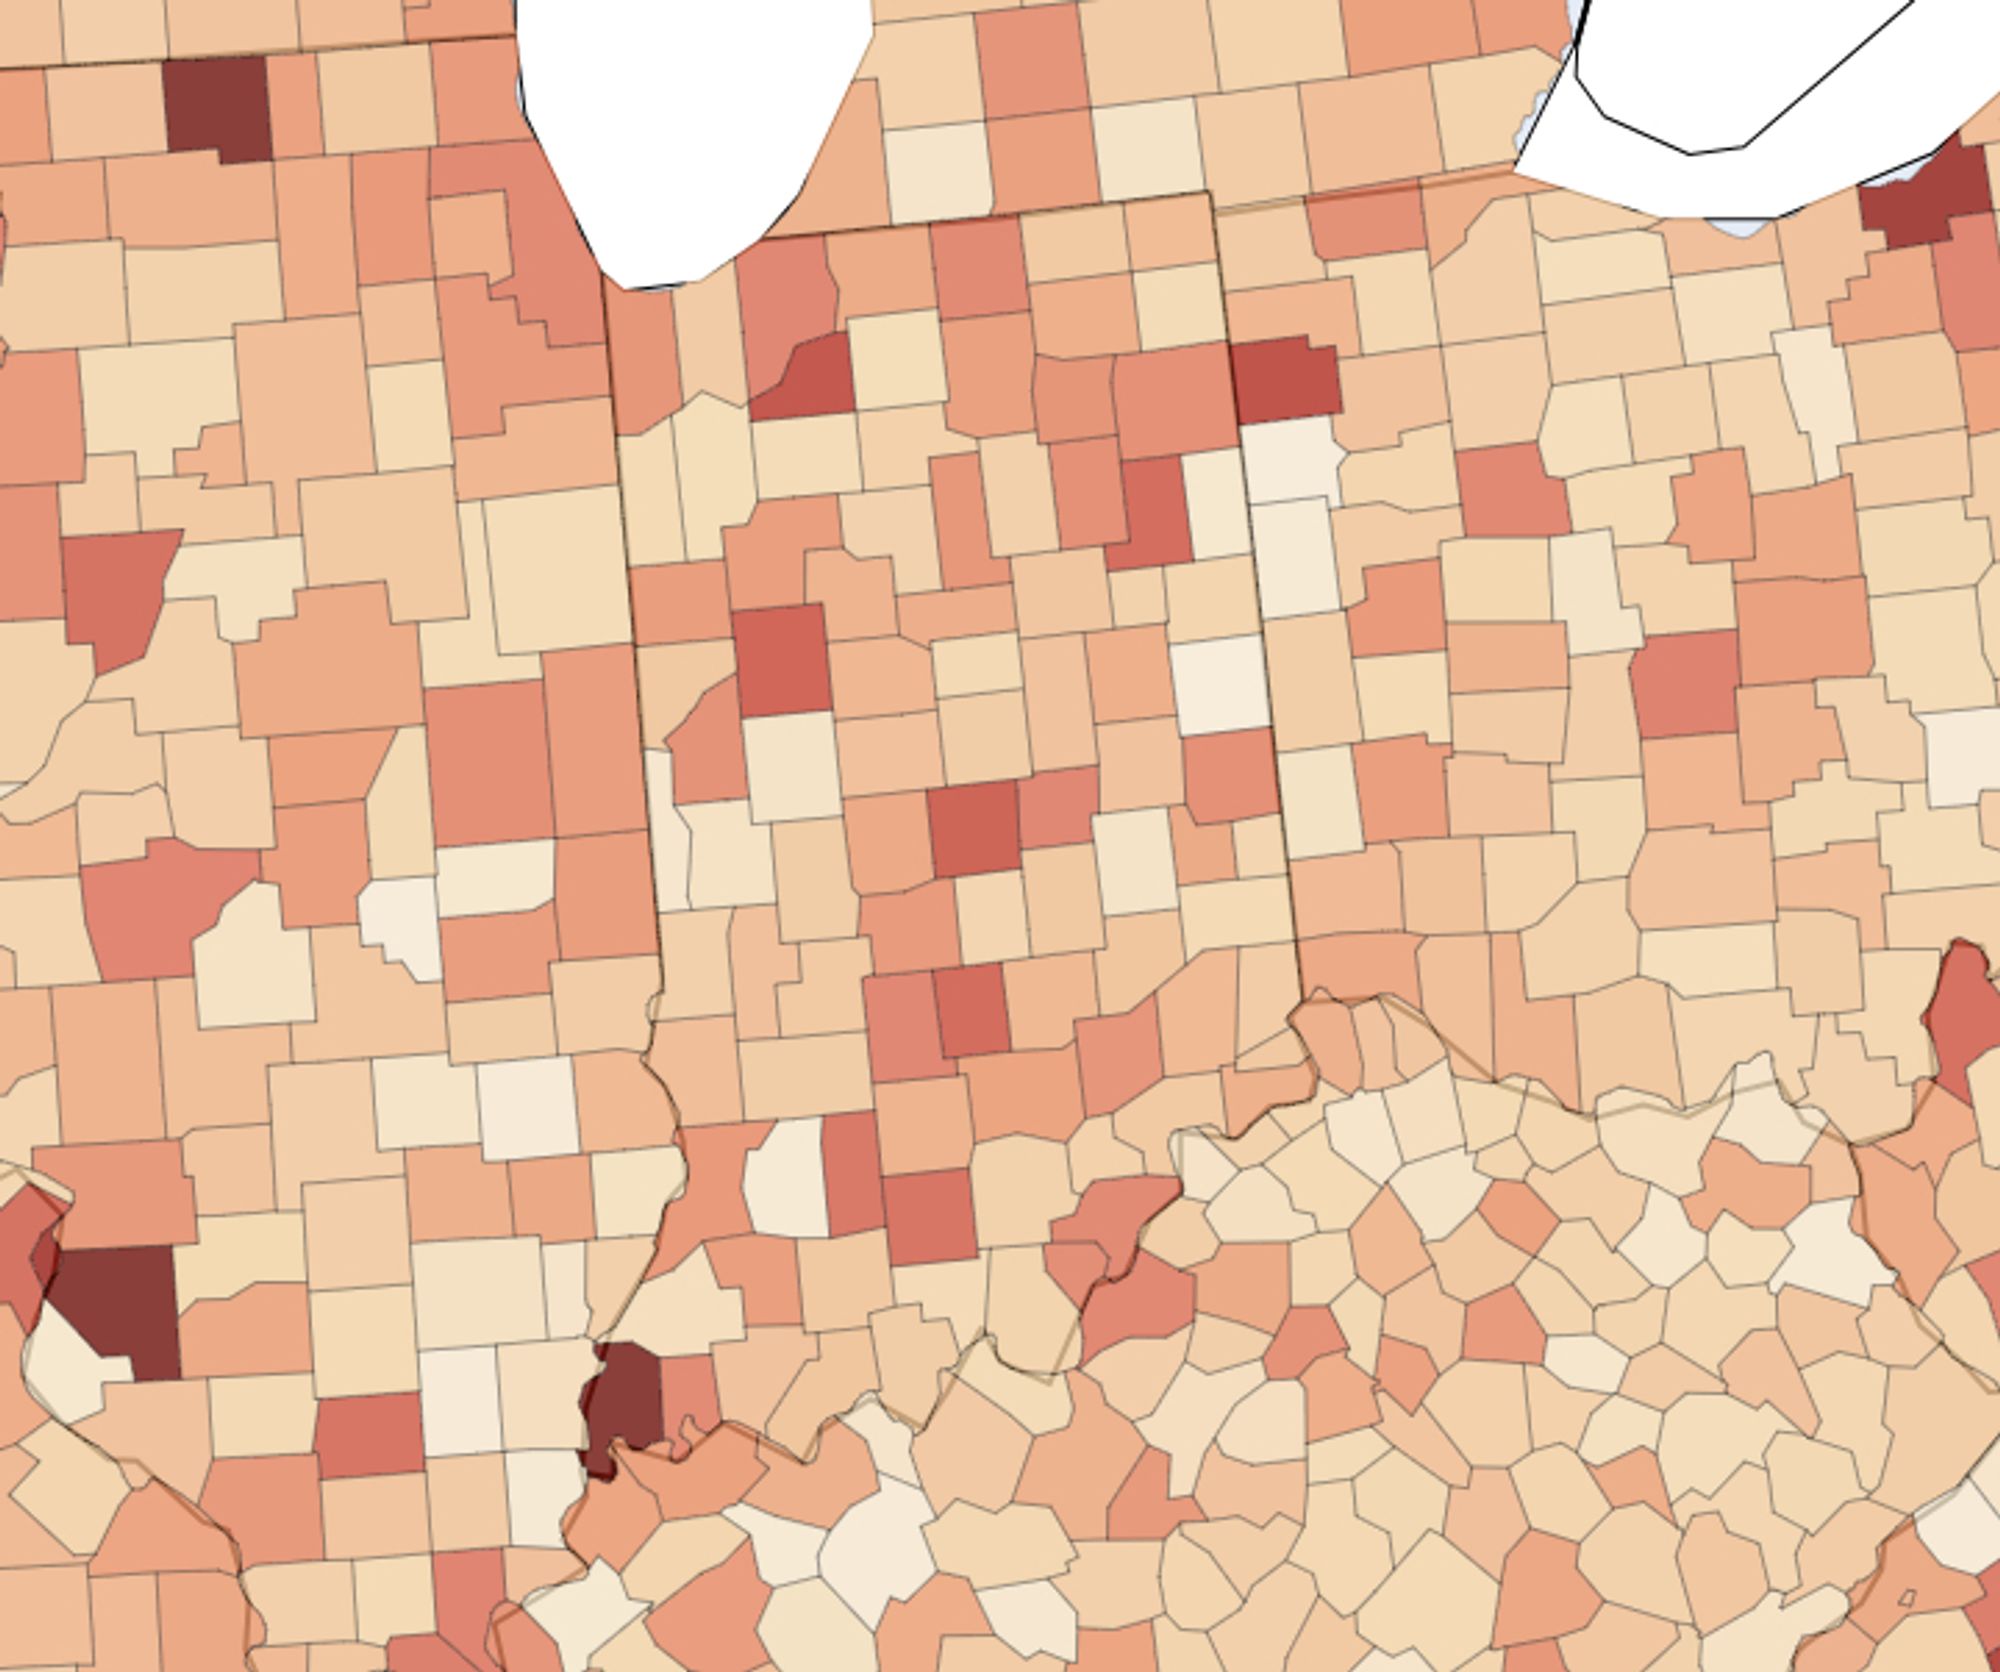
The map below shows the unrecognized tap rate by county. As in December, pockets of theft can be seen in Northern and Central Virginia as well as Southern Maryland. This geographic pattern — concentrated areas with elevated theft across counties and states — indicates skimmers are being used to compromise cards.
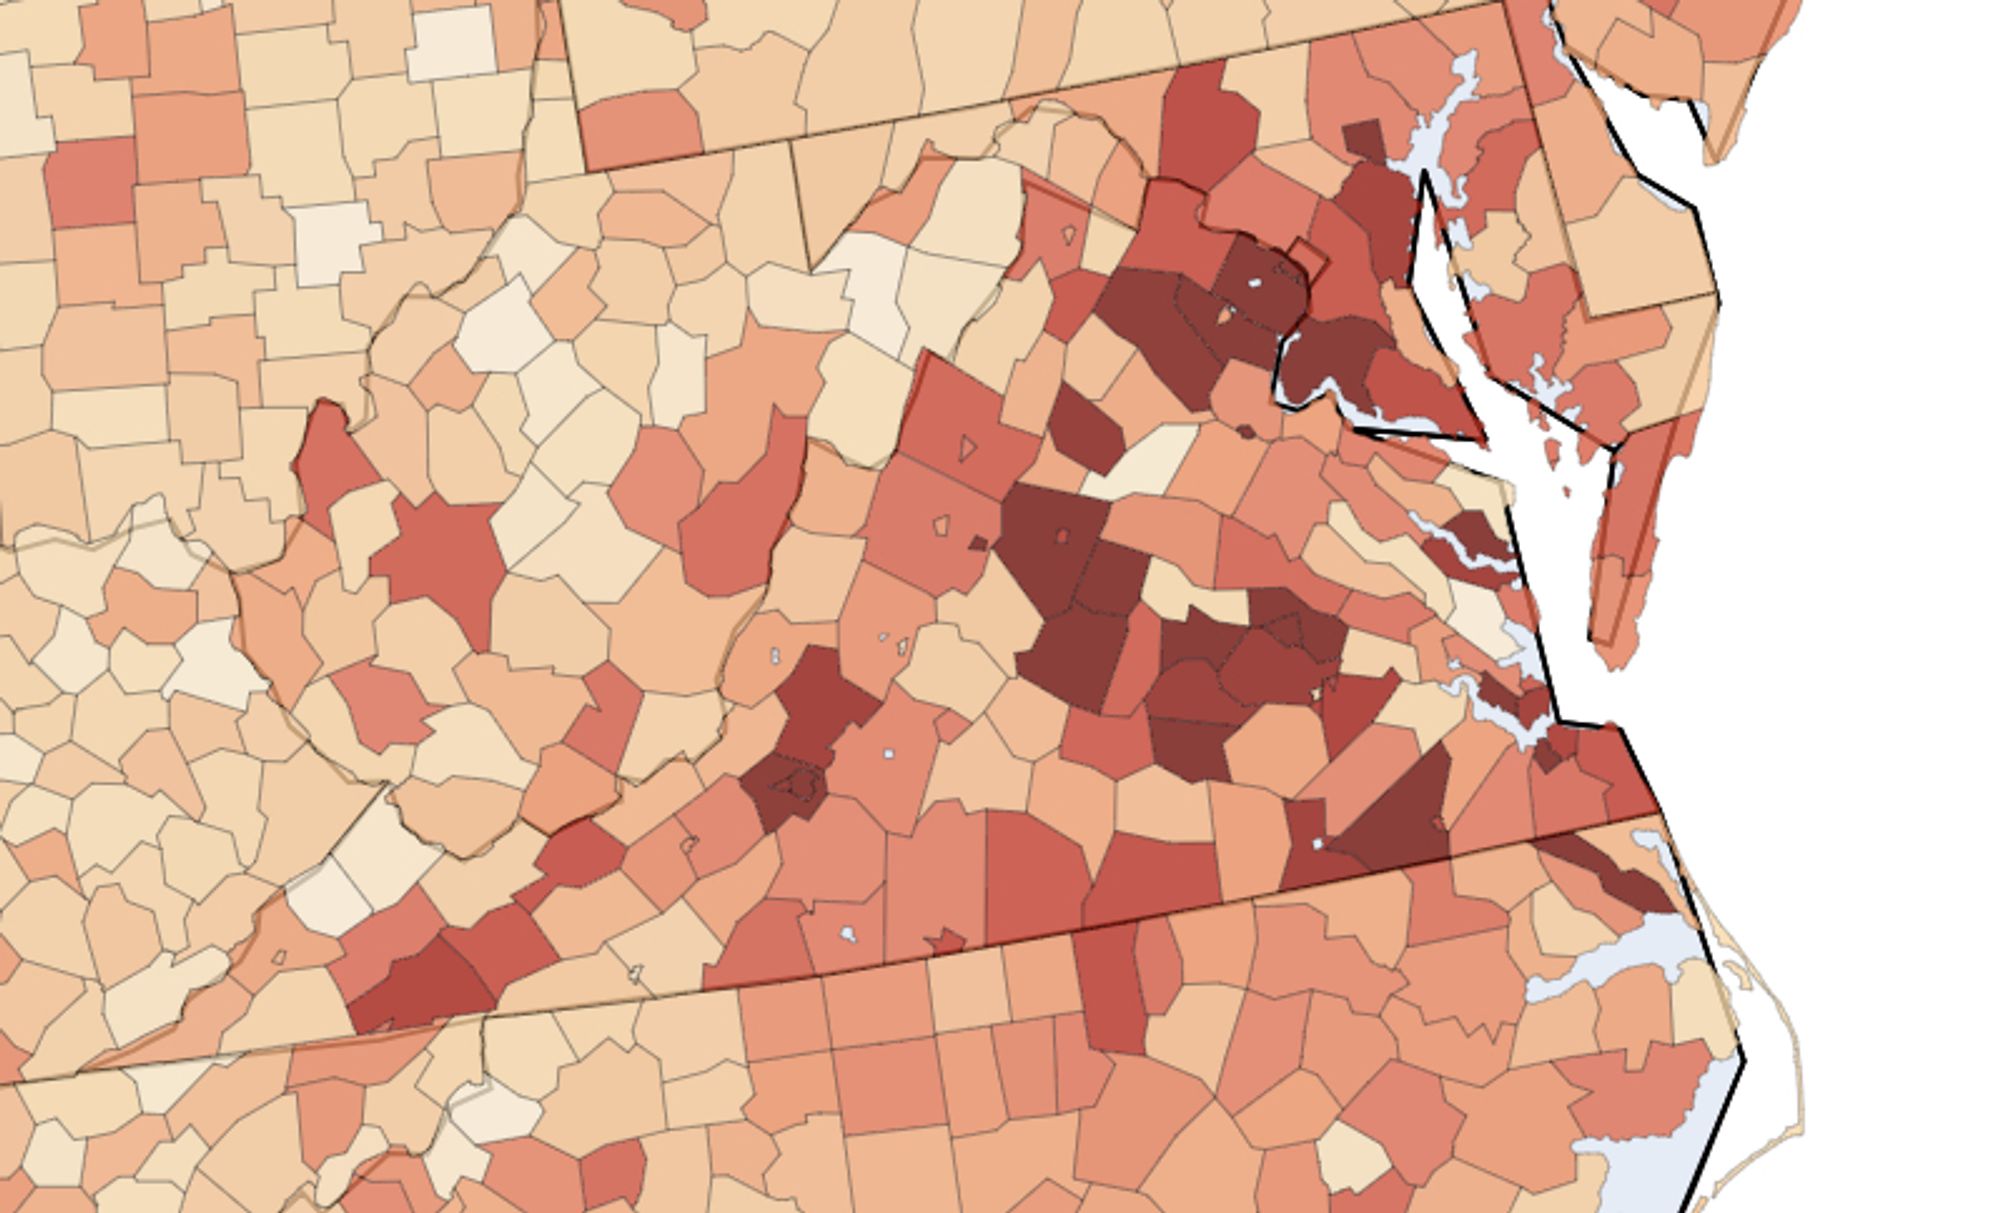
Virginia and Maryland both saw skimming activity concentrated at specific retail chains. In Virginia, skimming was concentrated at stores in Central and Northern Virginia, particularly in Alexandria and Arlington.
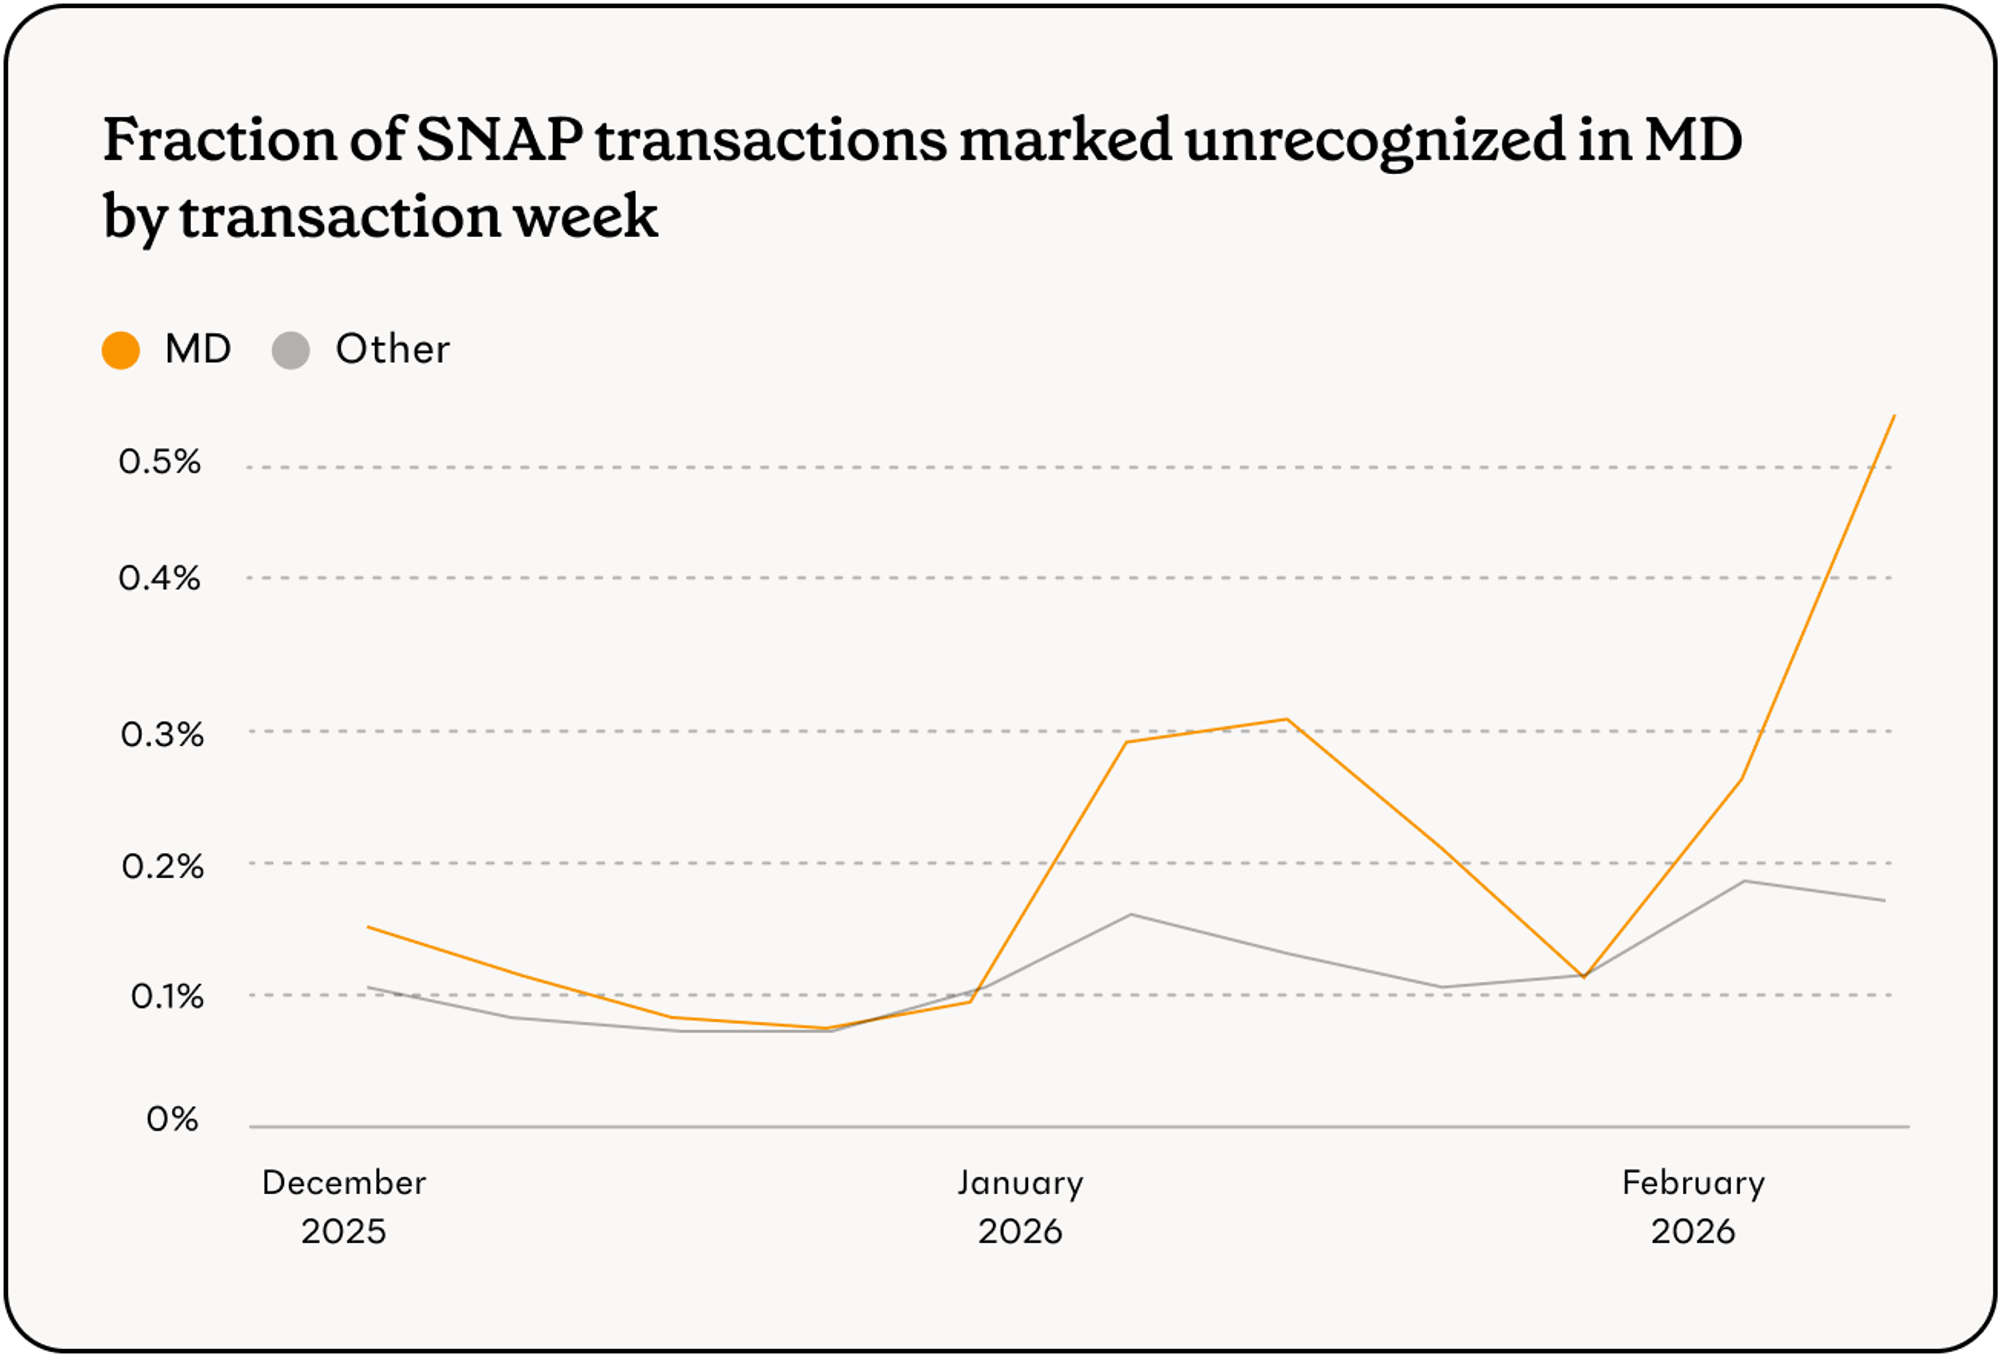
Theft in Maryland increases across SNAP and cash#theft-in-maryland-increases-across-snap-and-cash
Maryland’s uptick in theft was driven by both SNAP and cash transactions. Unlike in past months with high Maryland fraud, the majority of fraud came from SNAP. Though fraud rates were lower for SNAP, overall SNAP volume is much higher, which accounts for the theft volume difference.
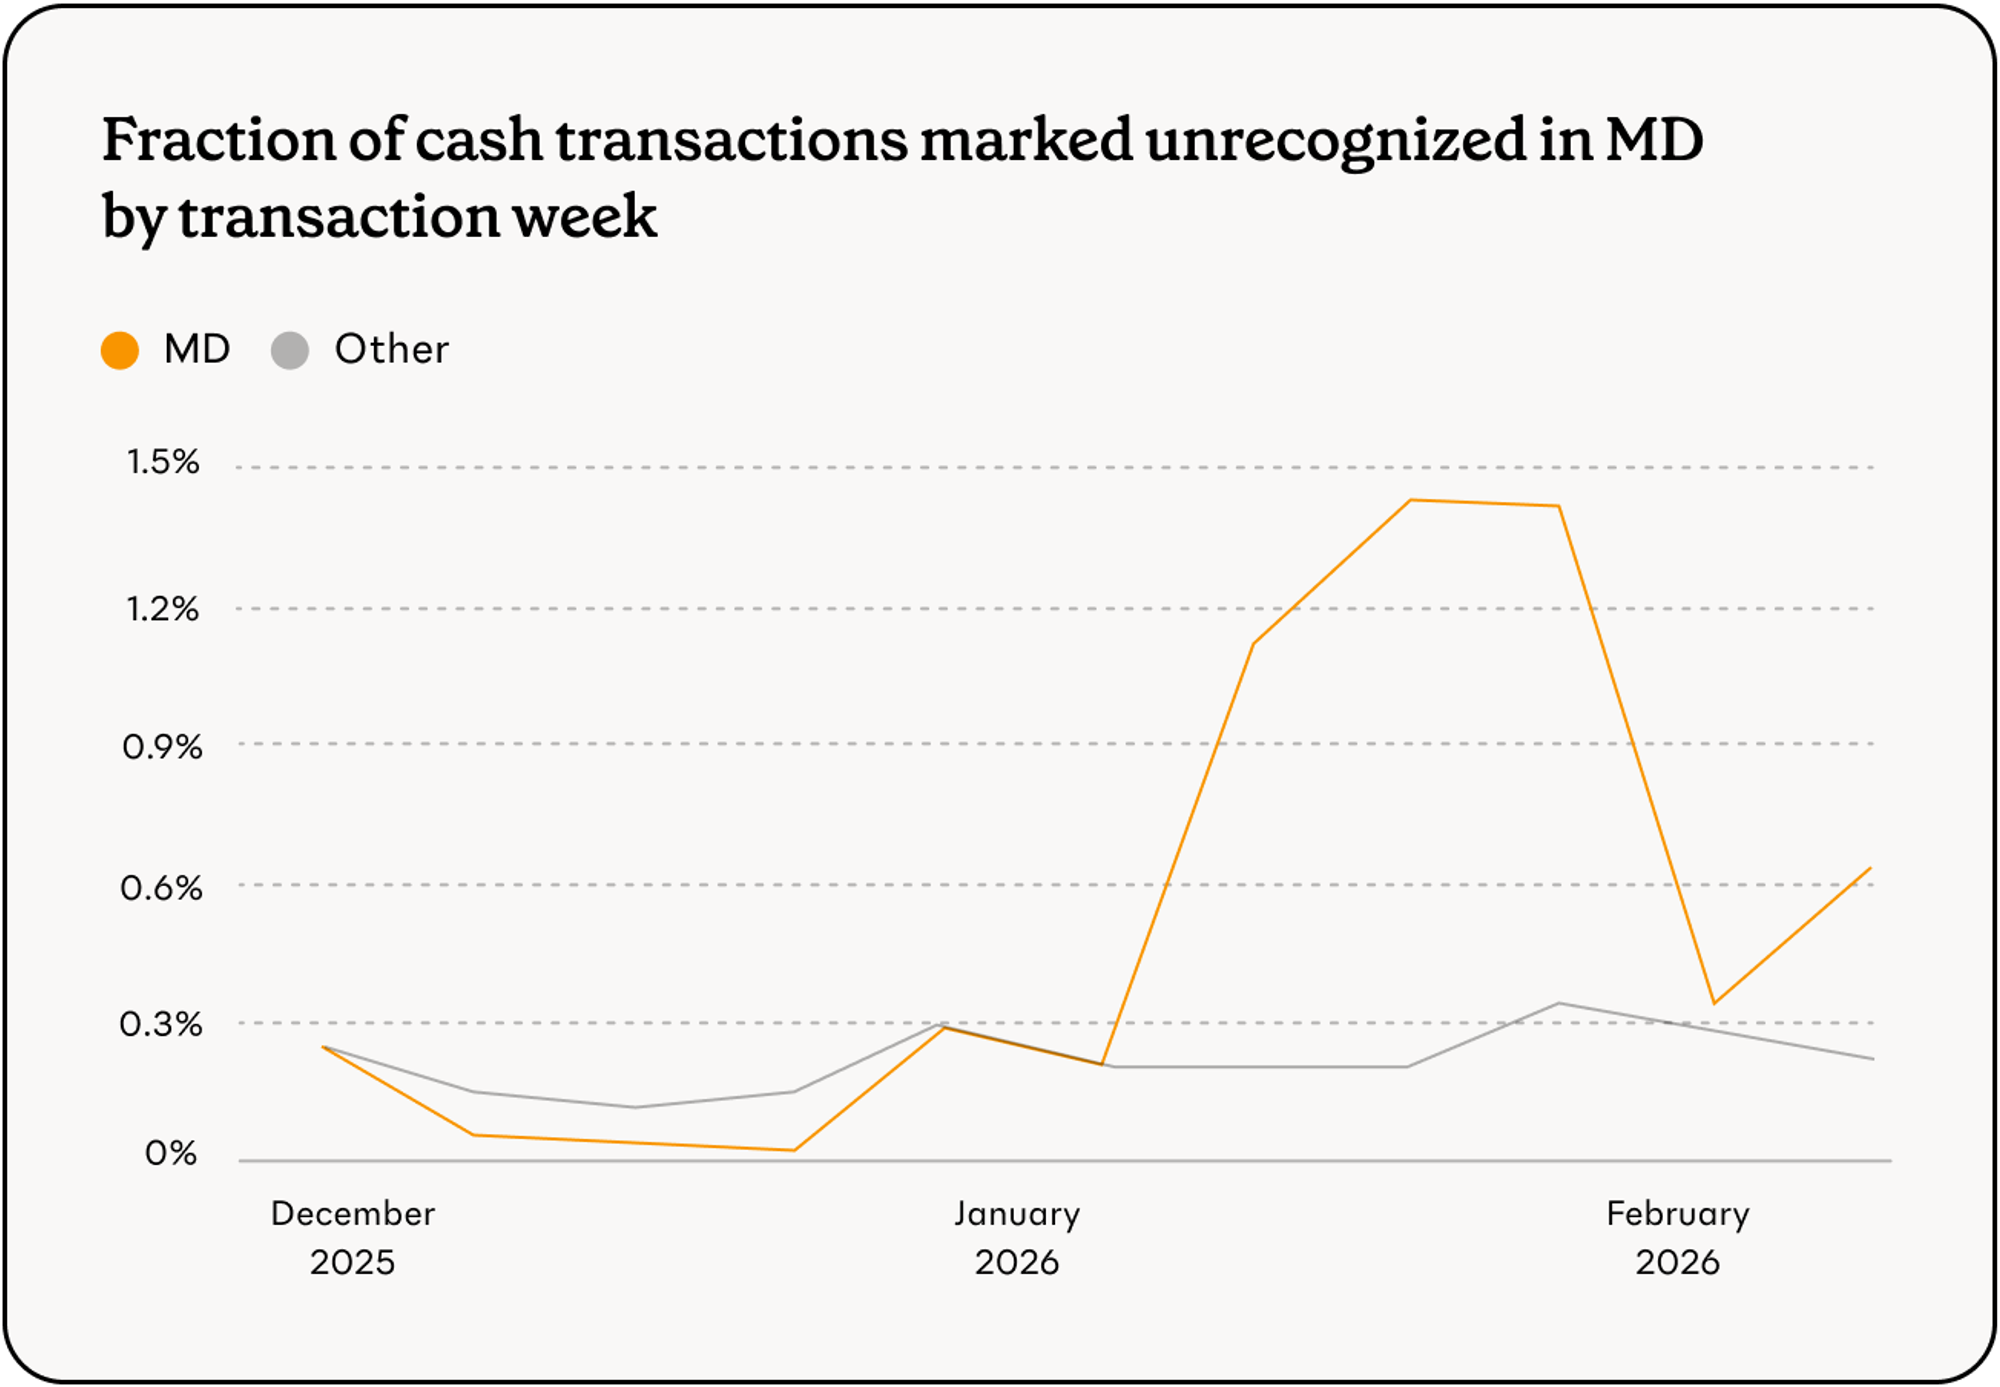
There is no overlap in liquidators between SNAP and cash fraud. This makes sense as cash liquidation generally takes place at ATMs, where SNAP benefits cannot be used. There also is no overlap in potential skimmers — different retail locations seem to account for SNAP skimming versus cash skimming.
Arkansas and Indiana continue to see elevated theft#arkansas-and-indiana-continue-to-see-elevated-theft
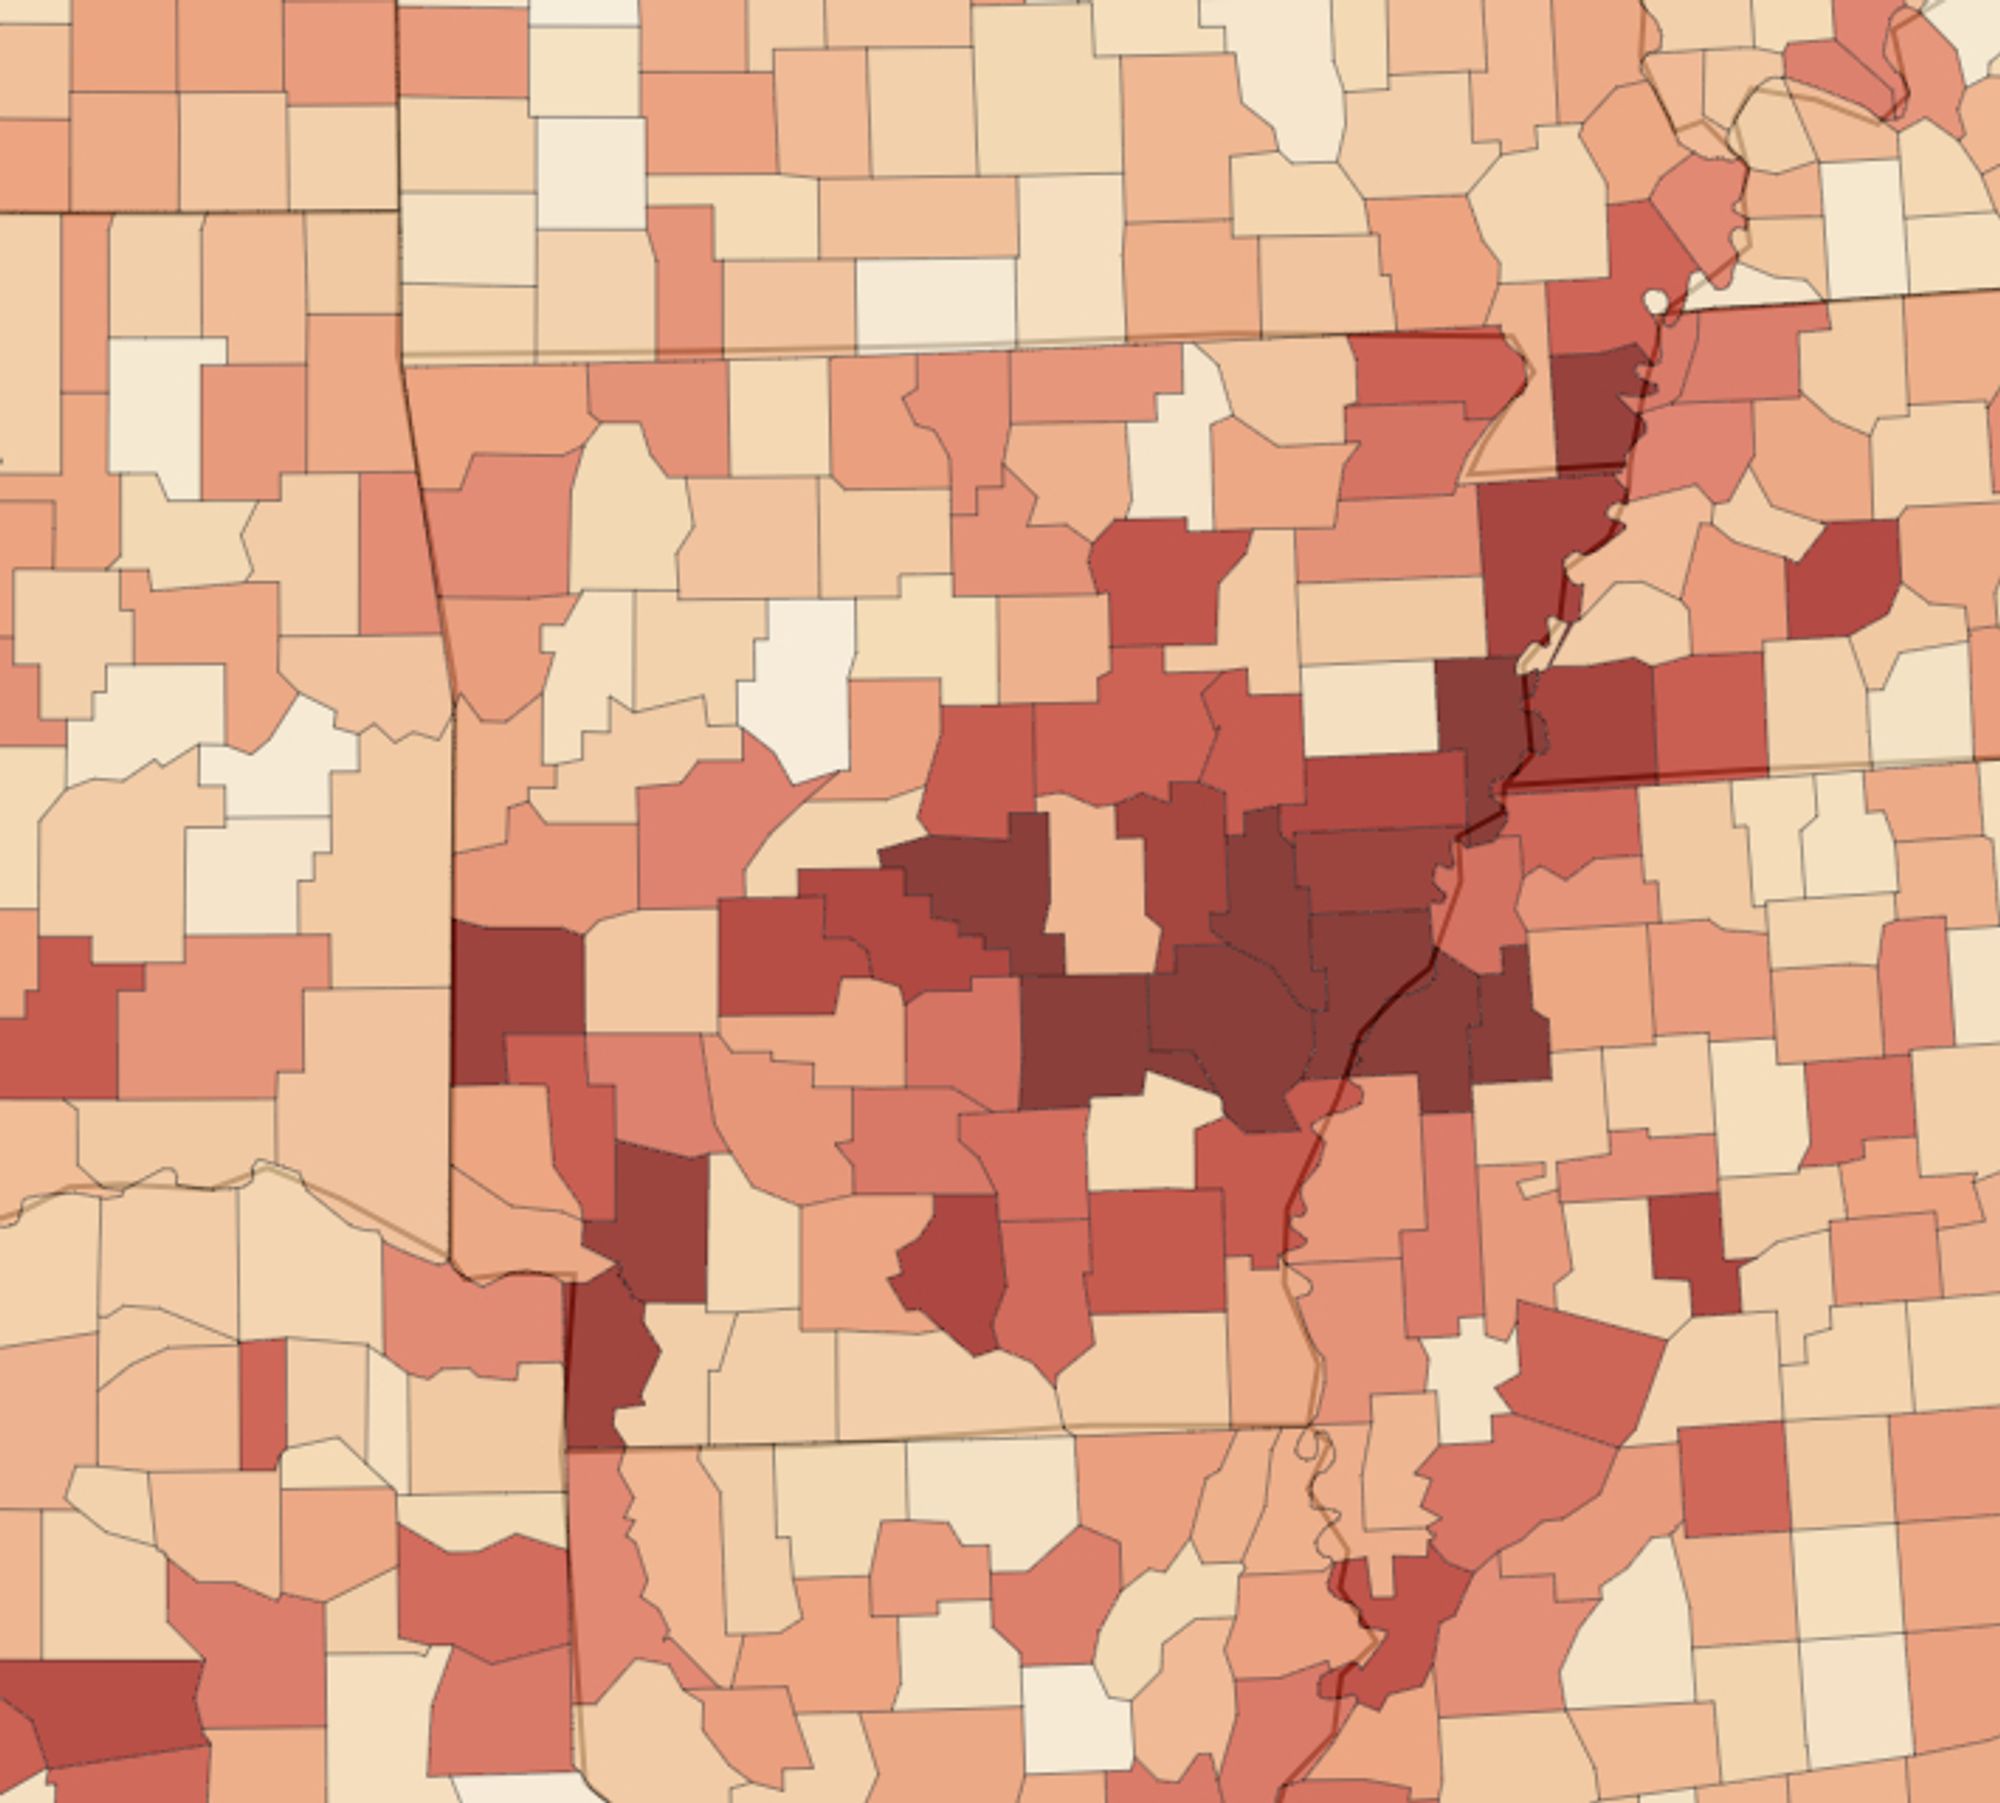
Both Arkansas and Indiana continue to see elevated theft but at a reduced level in comparison to December and January. Their elevated theft cannot be attributed to specific skimmers, though geographic patterns do not indicate a statewide data compromise.
Arkansas, in particular, shows signs of skimming since neighboring states have high theft levels close to the Arkansas border (e.g. Coahoma and Quitman, Mississippi, bordering southeast Arkansas).
Ongoing support#ongoing-support
Propel is committed to supporting state and federal agencies in protecting SNAP recipients from EBT theft. For questions about our methodology or further analysis, please contact gov@joinpropel.com.