Data insights: January 2026 EBT theft trends
Our editorial promise
All of our Propel editorial content meets our high bar for accuracy, timeliness, trust, and relevance. Our pages are edited and fact-checked to make sure we meet our mission of giving you information you can rely on.
Learn more about our editorial standards.
Return to Propel's EBT Theft Hub
Key findings#key-findings
- Overall amounts of EBT Theft increased as the government shutdown-driven dip in November subsided
- Virginia saw a high level of theft, seemingly driven by skimmers concentrated at specific retail chains
- Arkansas and Indiana both saw increases in the rate of theft after recent decreases
- Nebraska has experienced a rapid increase in theft reports in nearly January
Propel’s theft detection capabilities#propels-theft-detection-capabilities
Propel serves over 5 million EBT cardholders nationwide who use our app to manage their benefits every month. We analyze transaction and customer-reported data to identify emerging theft patterns through a two-step detection process. First, we identify retailers with unusually high rates of transactions flagged as "unrecognized" by Propel users. These are retailers where stolen benefits appear to be drained or liquidated. Second, we identify skimmer locations by analyzing victims’ shopping patterns in the 8-12 weeks prior to their card being liquidated.
Our insights are intended to provide a snapshot of emerging trends in EBT theft. We generate these analyses early in the month, when theft activity typically peaks following SNAP benefit deposits. Our data reflects real theft activity, but may show a slight upward bias since cardholders are more likely to check the app after experiencing theft. Given the rapidly evolving nature of EBT theft, our insights represent a current snapshot rather than a comprehensive assessment.
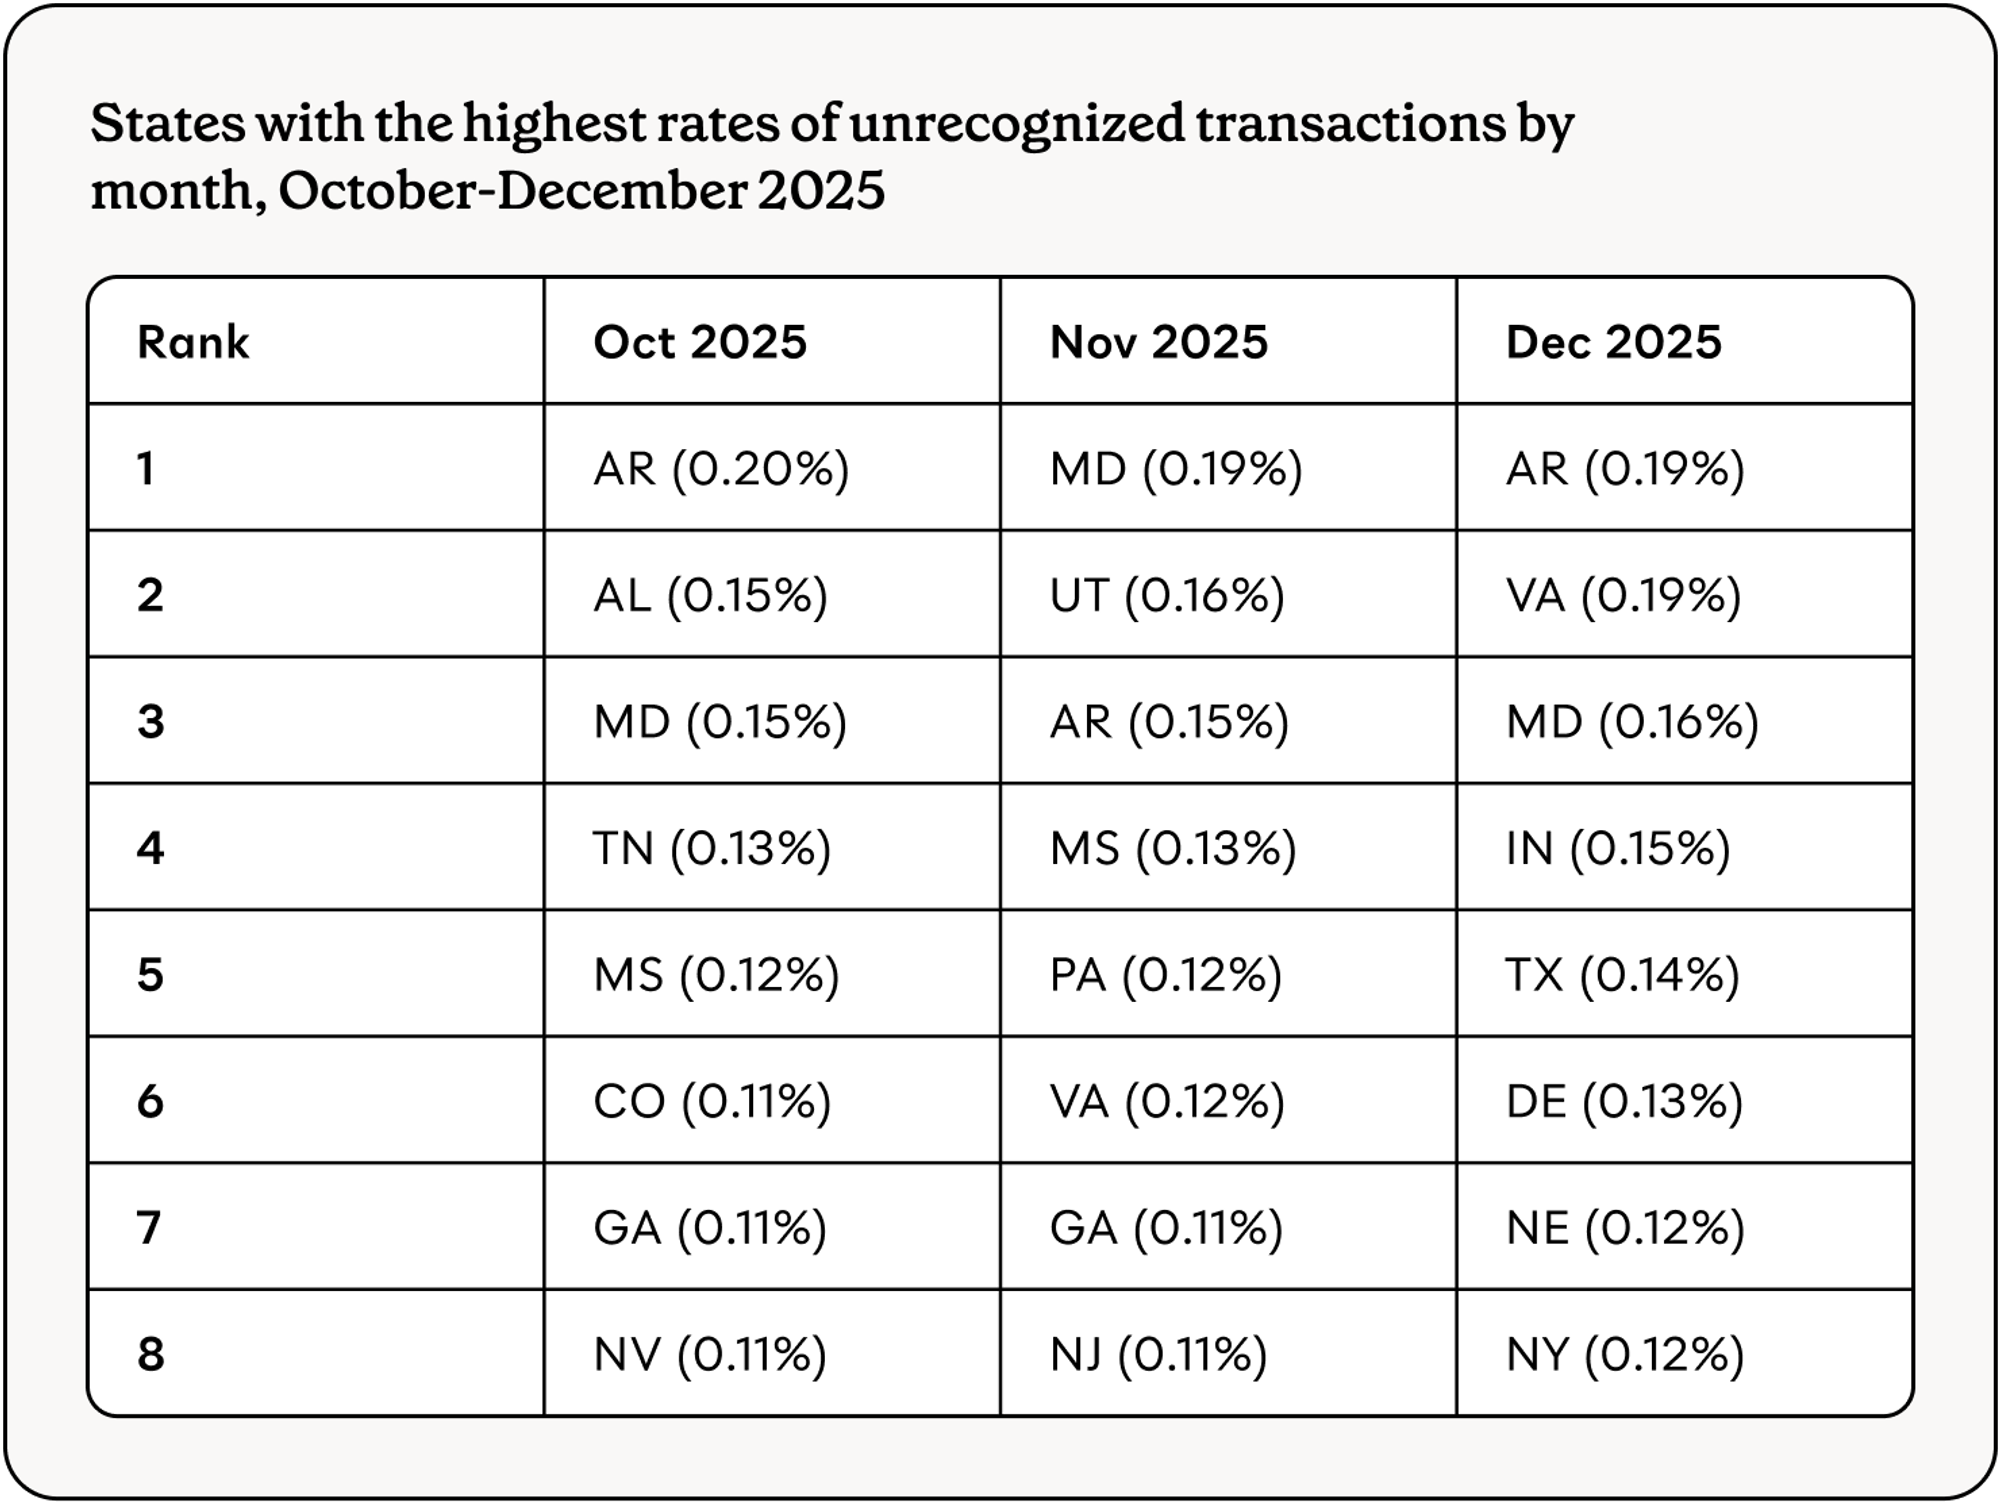
Recent theft patterns and spikes#recent-theft-patterns-and-spikes
Overall theft amounts increased as the shutdown driven dip in theft subsided. Arkansas and Indiana saw increases in the rate of theft after recent decreases. Nebraska is emerging as a hot spot in early January data.
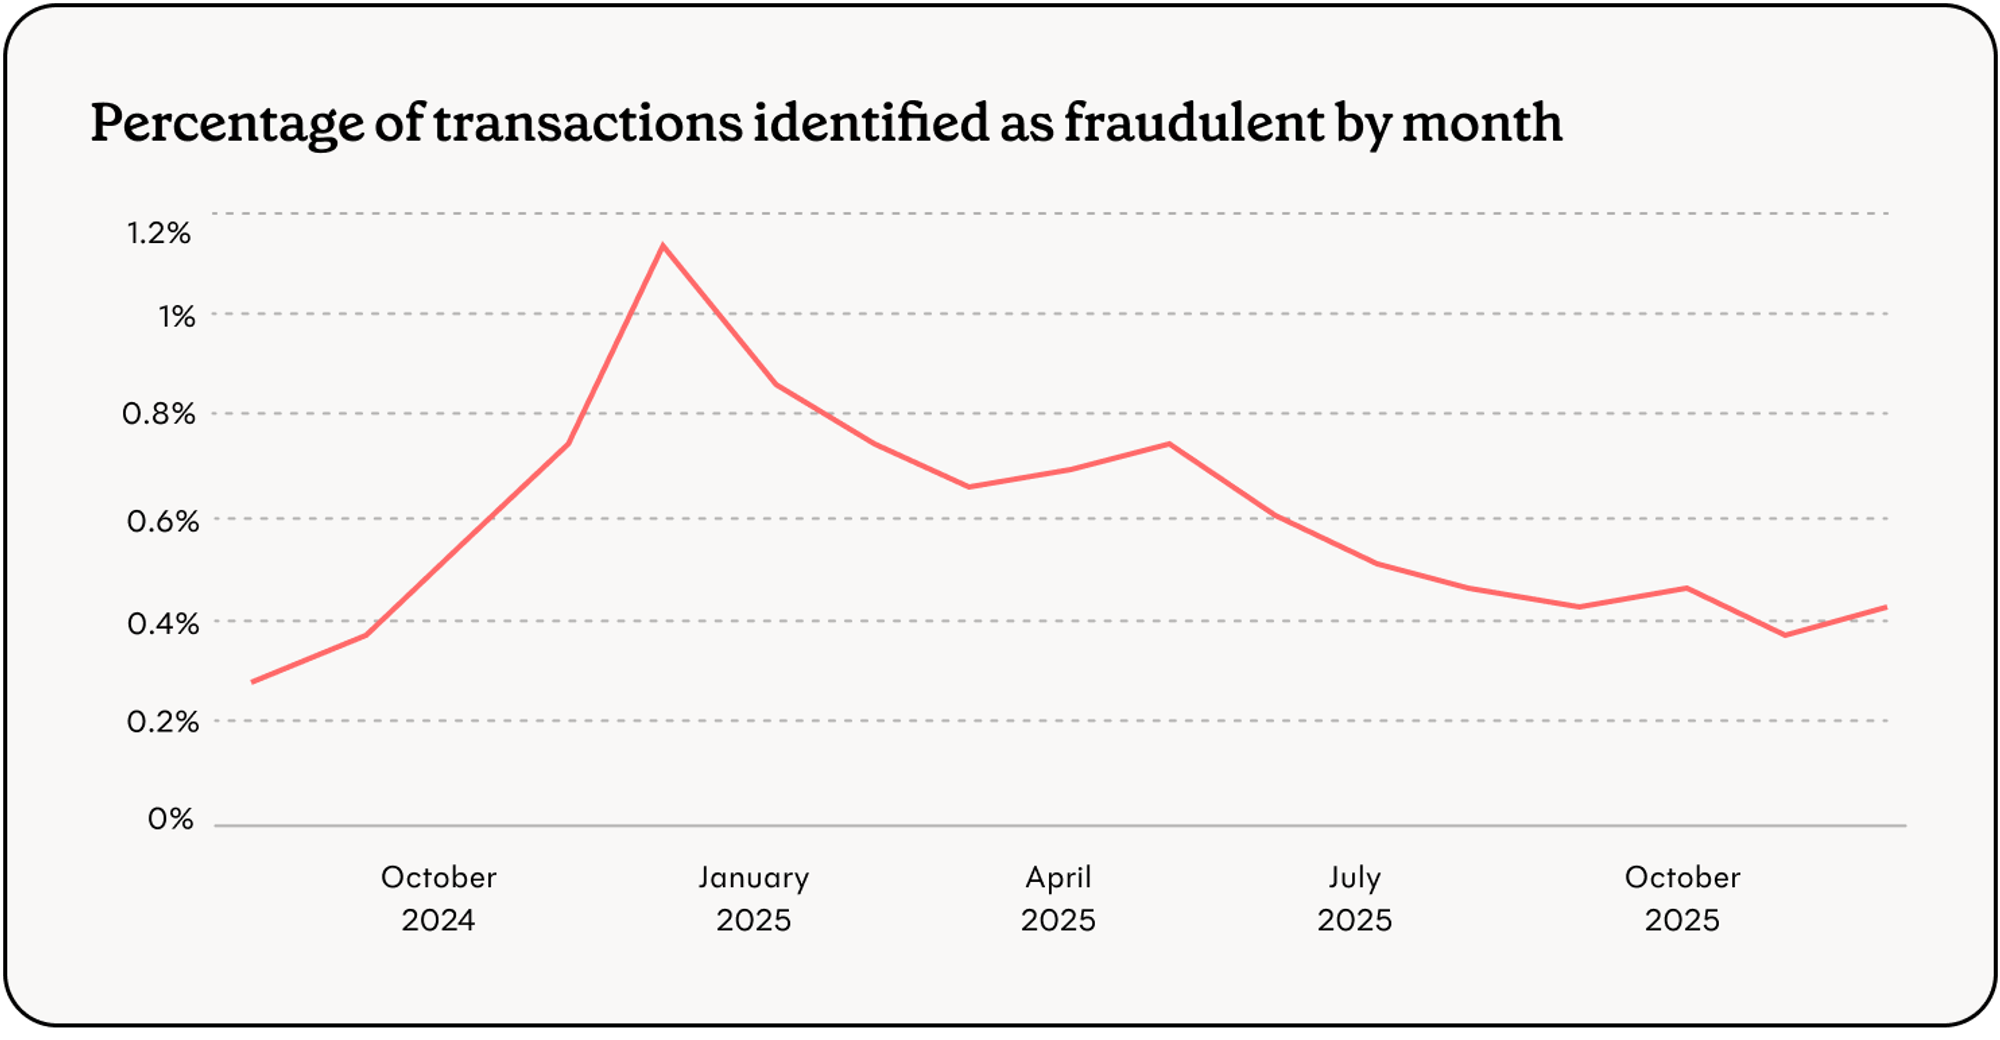
Slight uptick in theft following shutdown slowdown#slight-uptick-in-theft-following-shutdown-slowdown
December saw a small increase in theft from November (0.38% to 0.41%). This is a return to the typical rate after a slight dip in November, likely related to the shutdown. Despite this increase, the overall downward trend through the second half of 2025 held. In the seven months since May 2025, there have only been two month-over-month increases (including December’s).
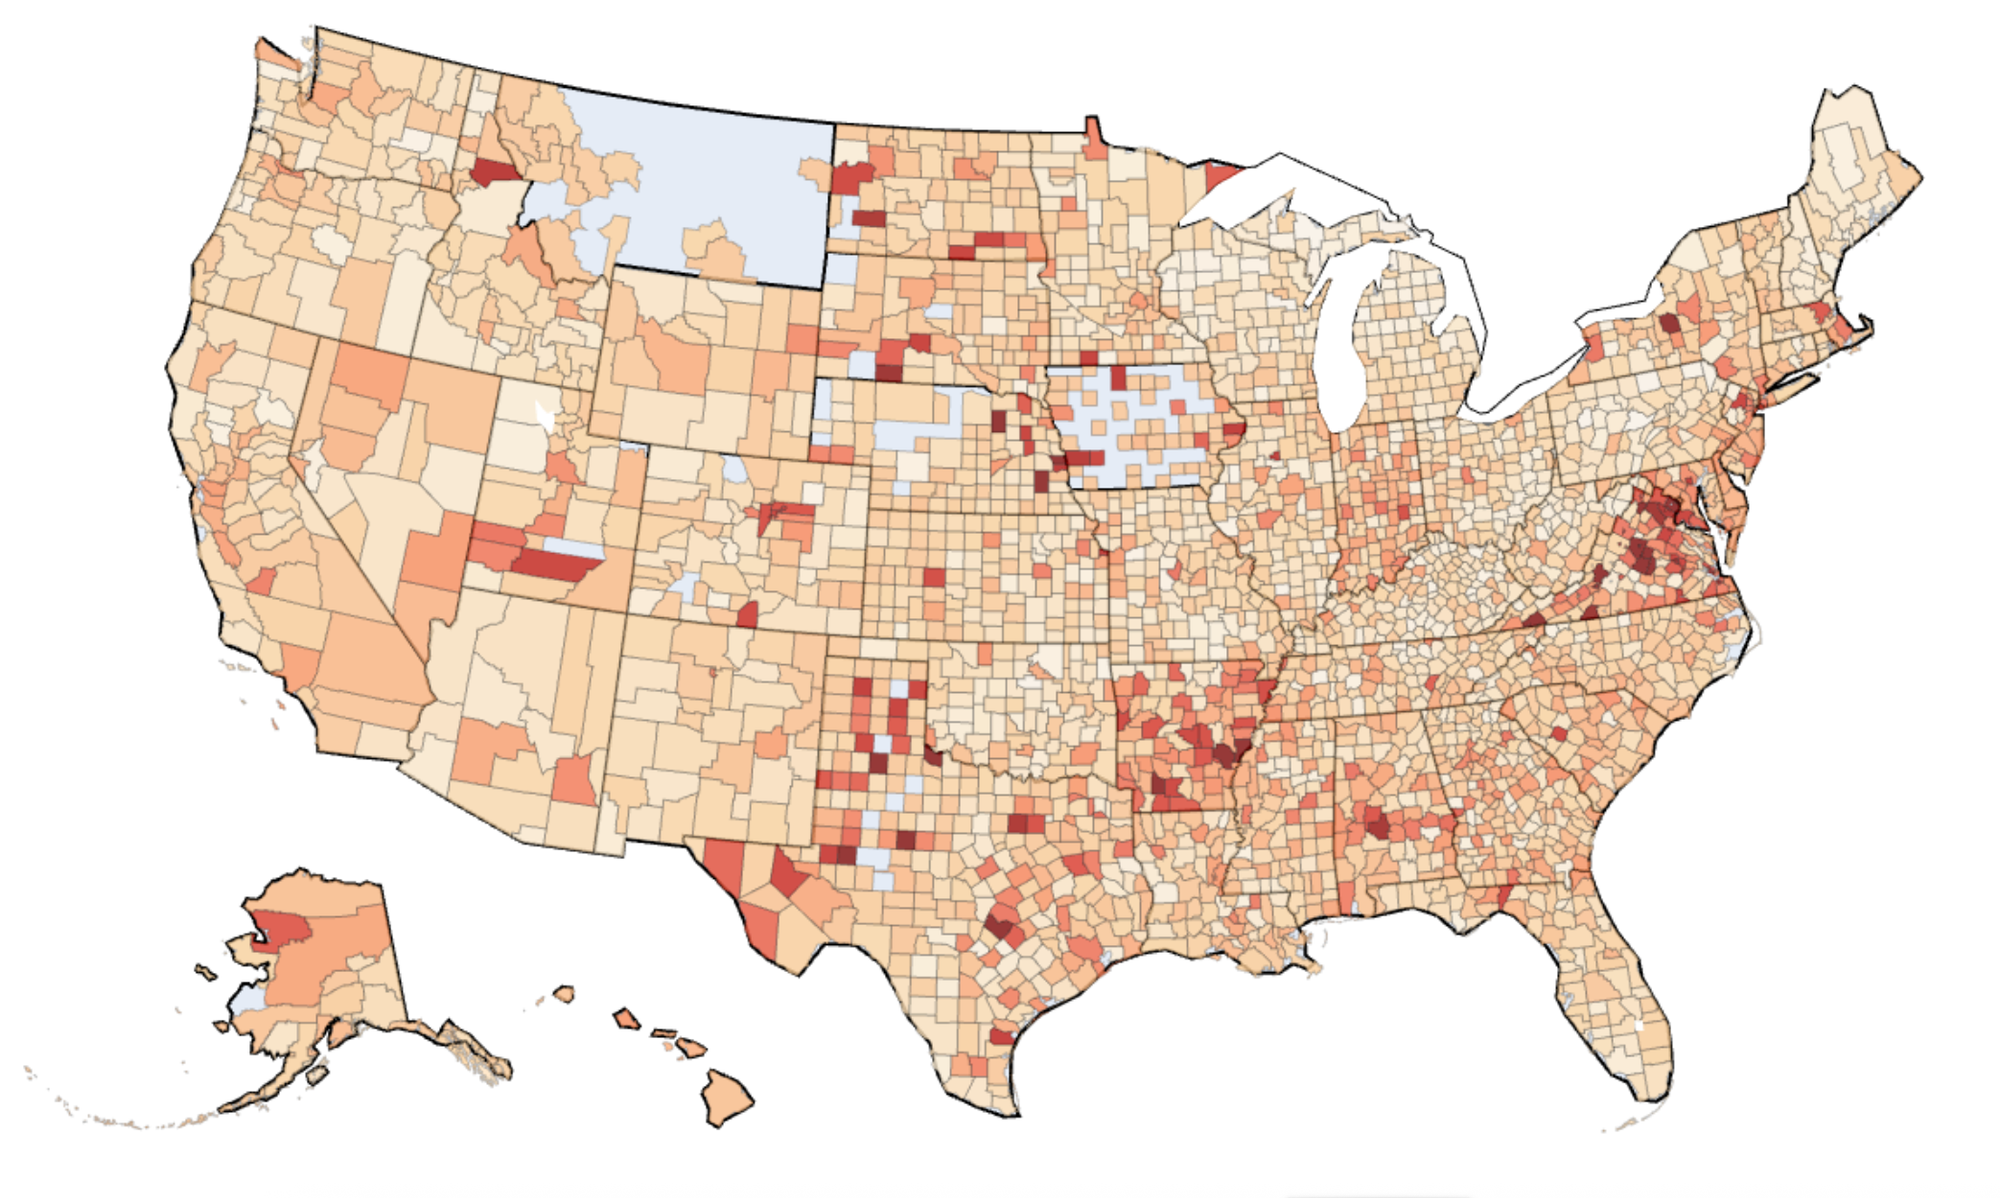
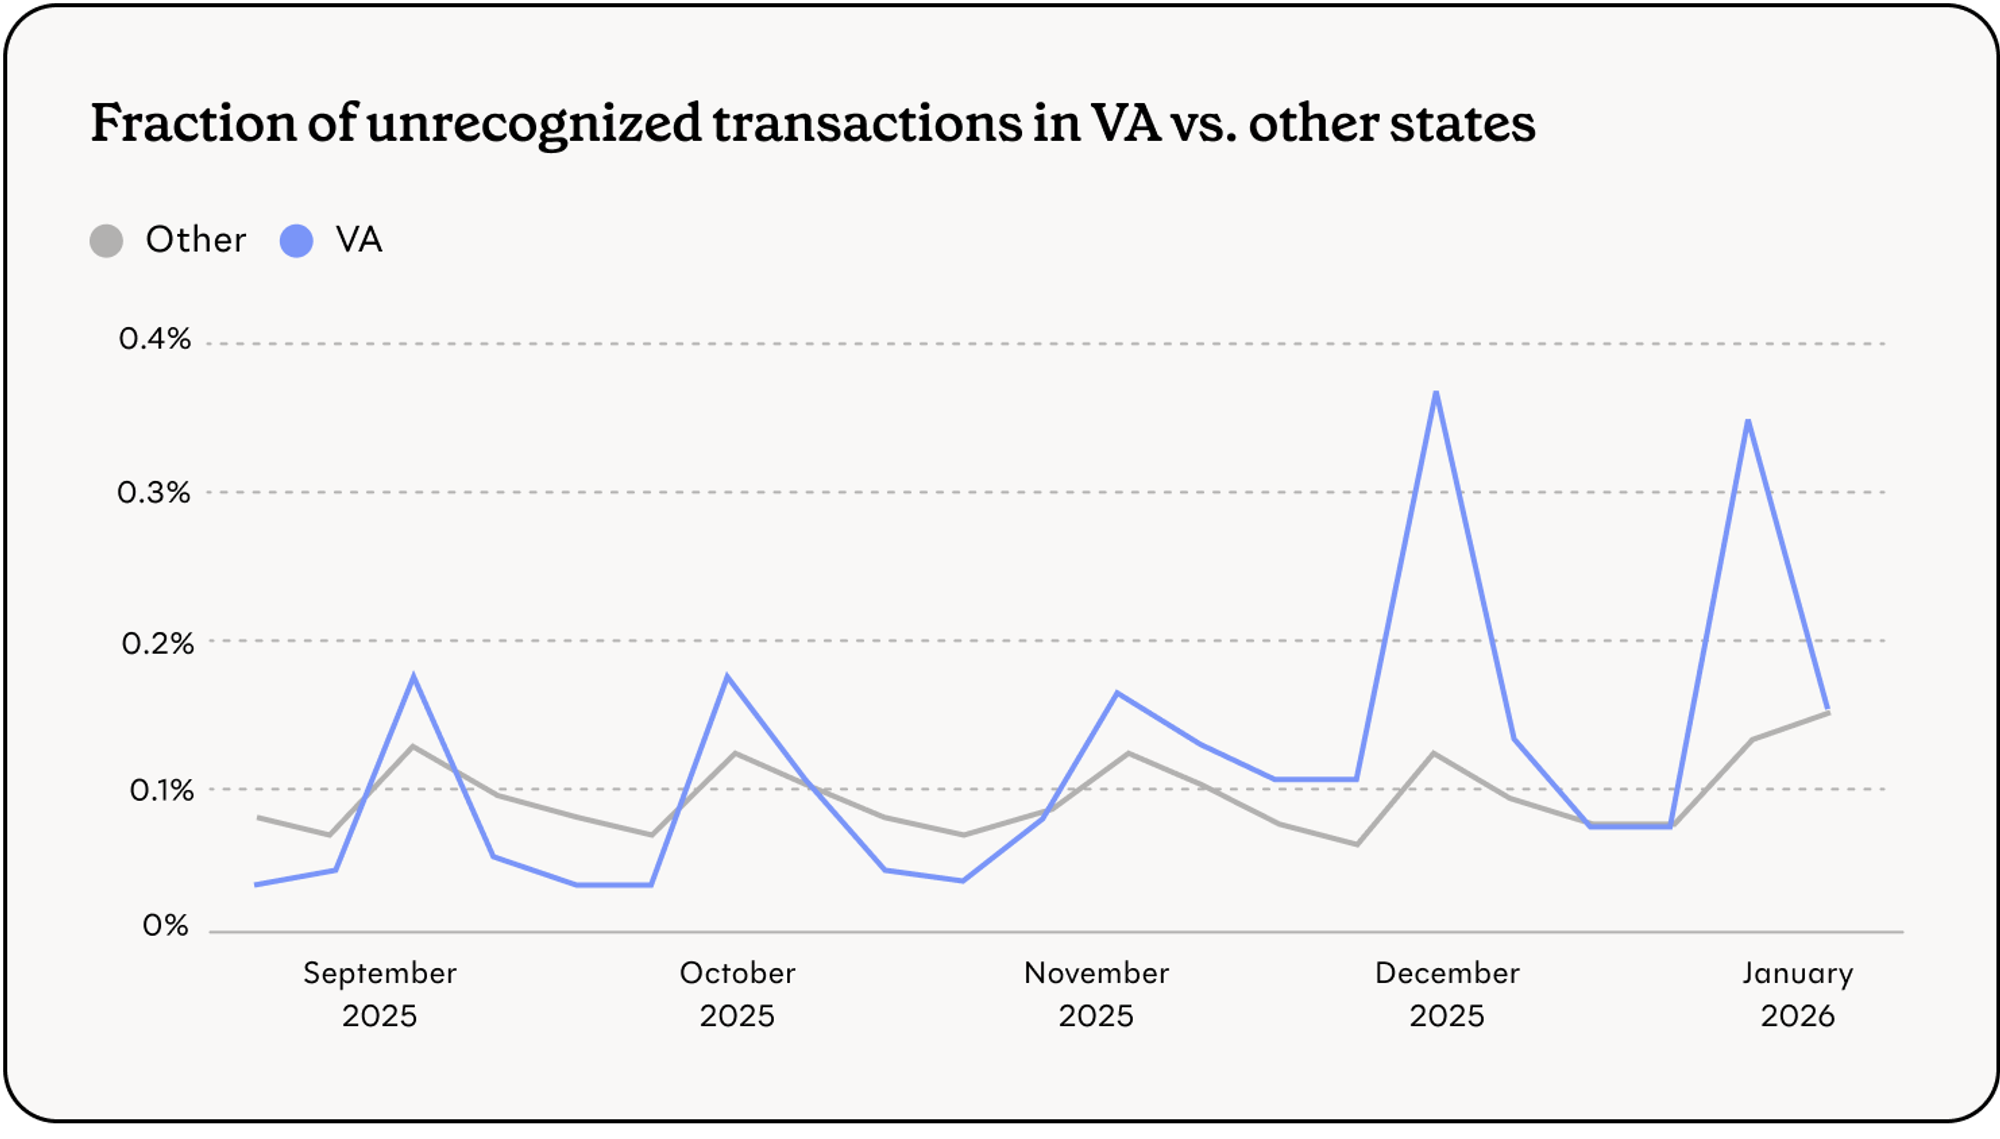
Virginia skimmers activity#virginia-skimmers-activity
Theft from Virginia users increased from November to December, and the increase seems to be sustained into January. Liquidation often took place at retailers purporting to be in Pennsylvania, New Jersey, and New York.
There were notable pockets of theft in Northern and Central Virginia, the former bleeding into Maryland. This geographic pattern – concentrated areas with elevated theft across counties and states – indicates skimmers are being used to compromise cards.
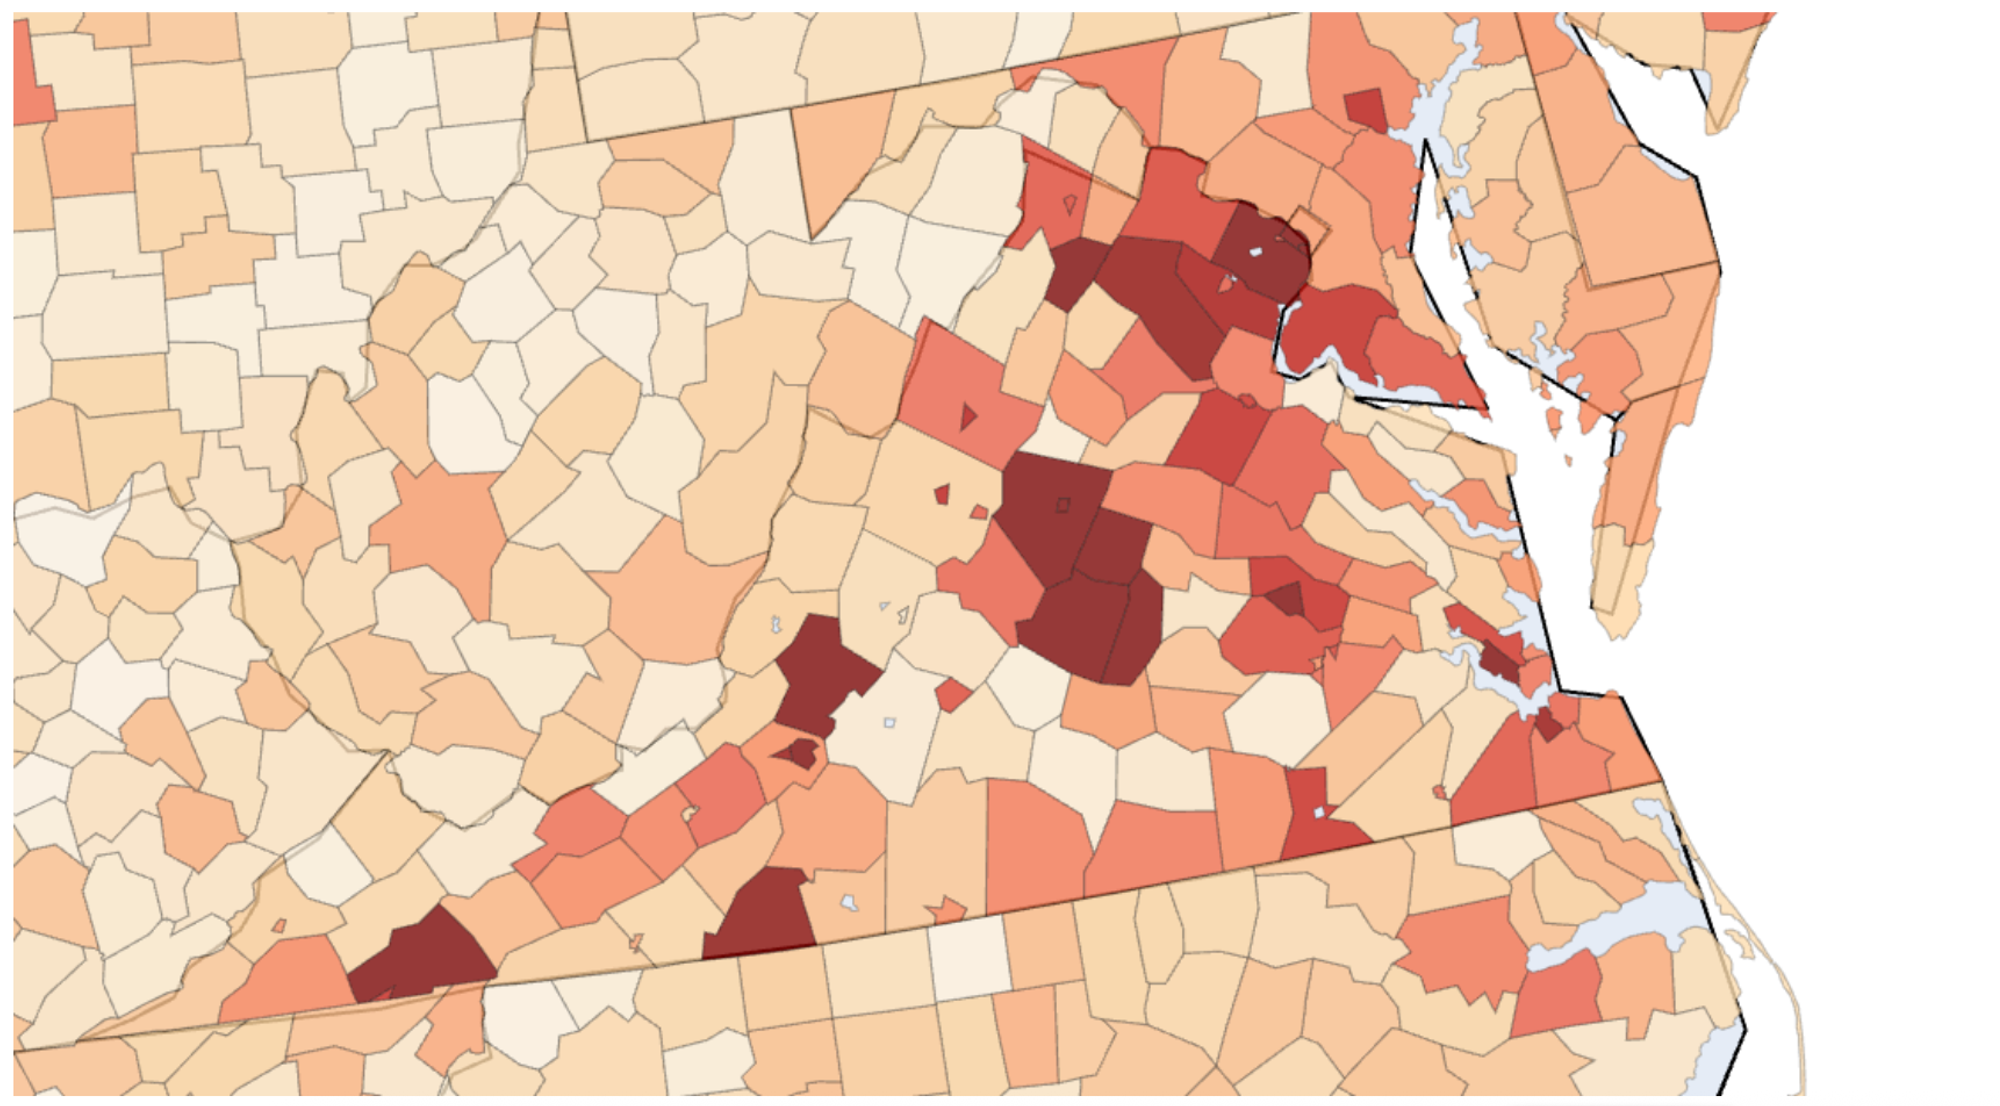
Virginia users who were liquidated in December and early January often had an earlier transaction at one of a specific set of retailers.
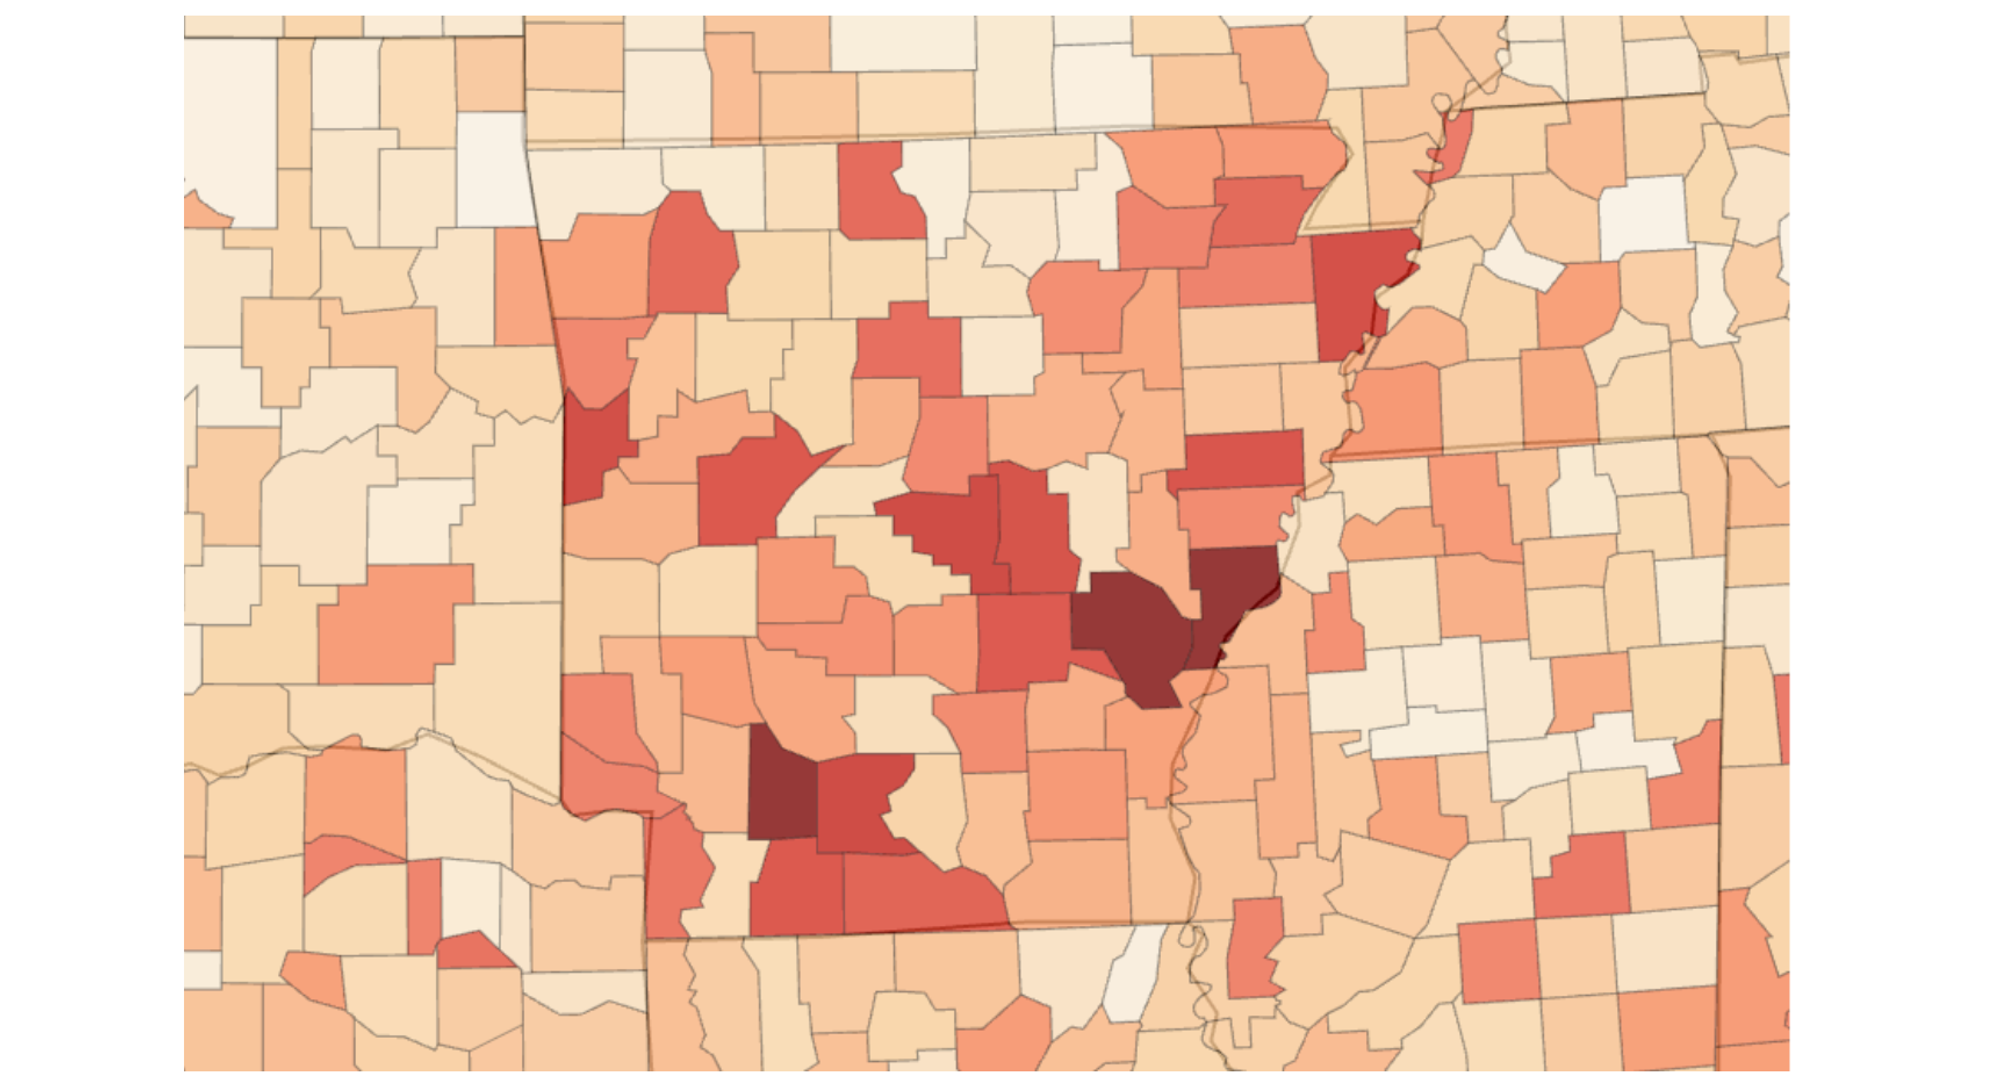
Arkansas theft back at October level#arkansas-theft-back-at-october-level
Following the national dip in November and increase in December, Arkansas theft returned to its October rate. As in Virginia, most liquidations happened at retailers purporting to be in Pennsylvania, New York, and New Jersey.
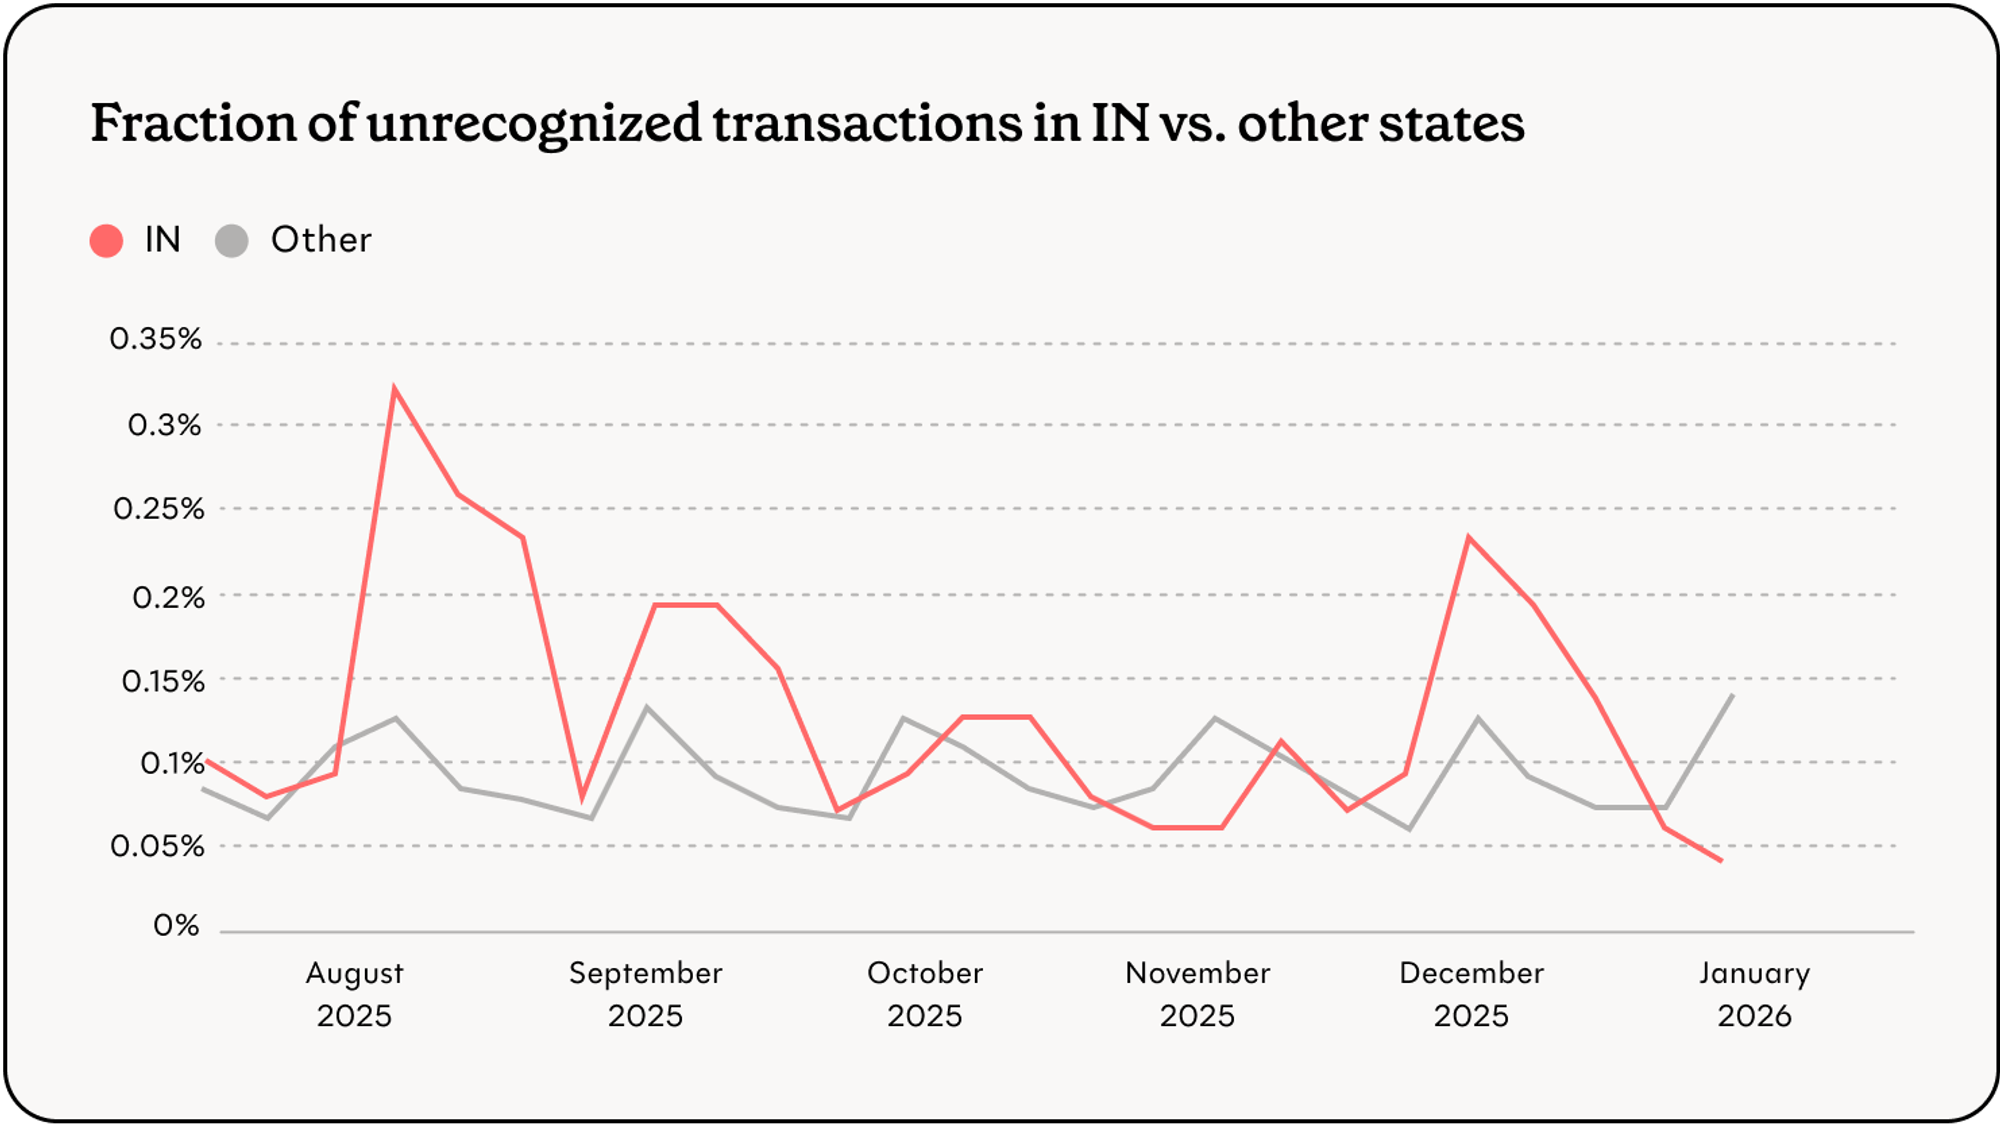
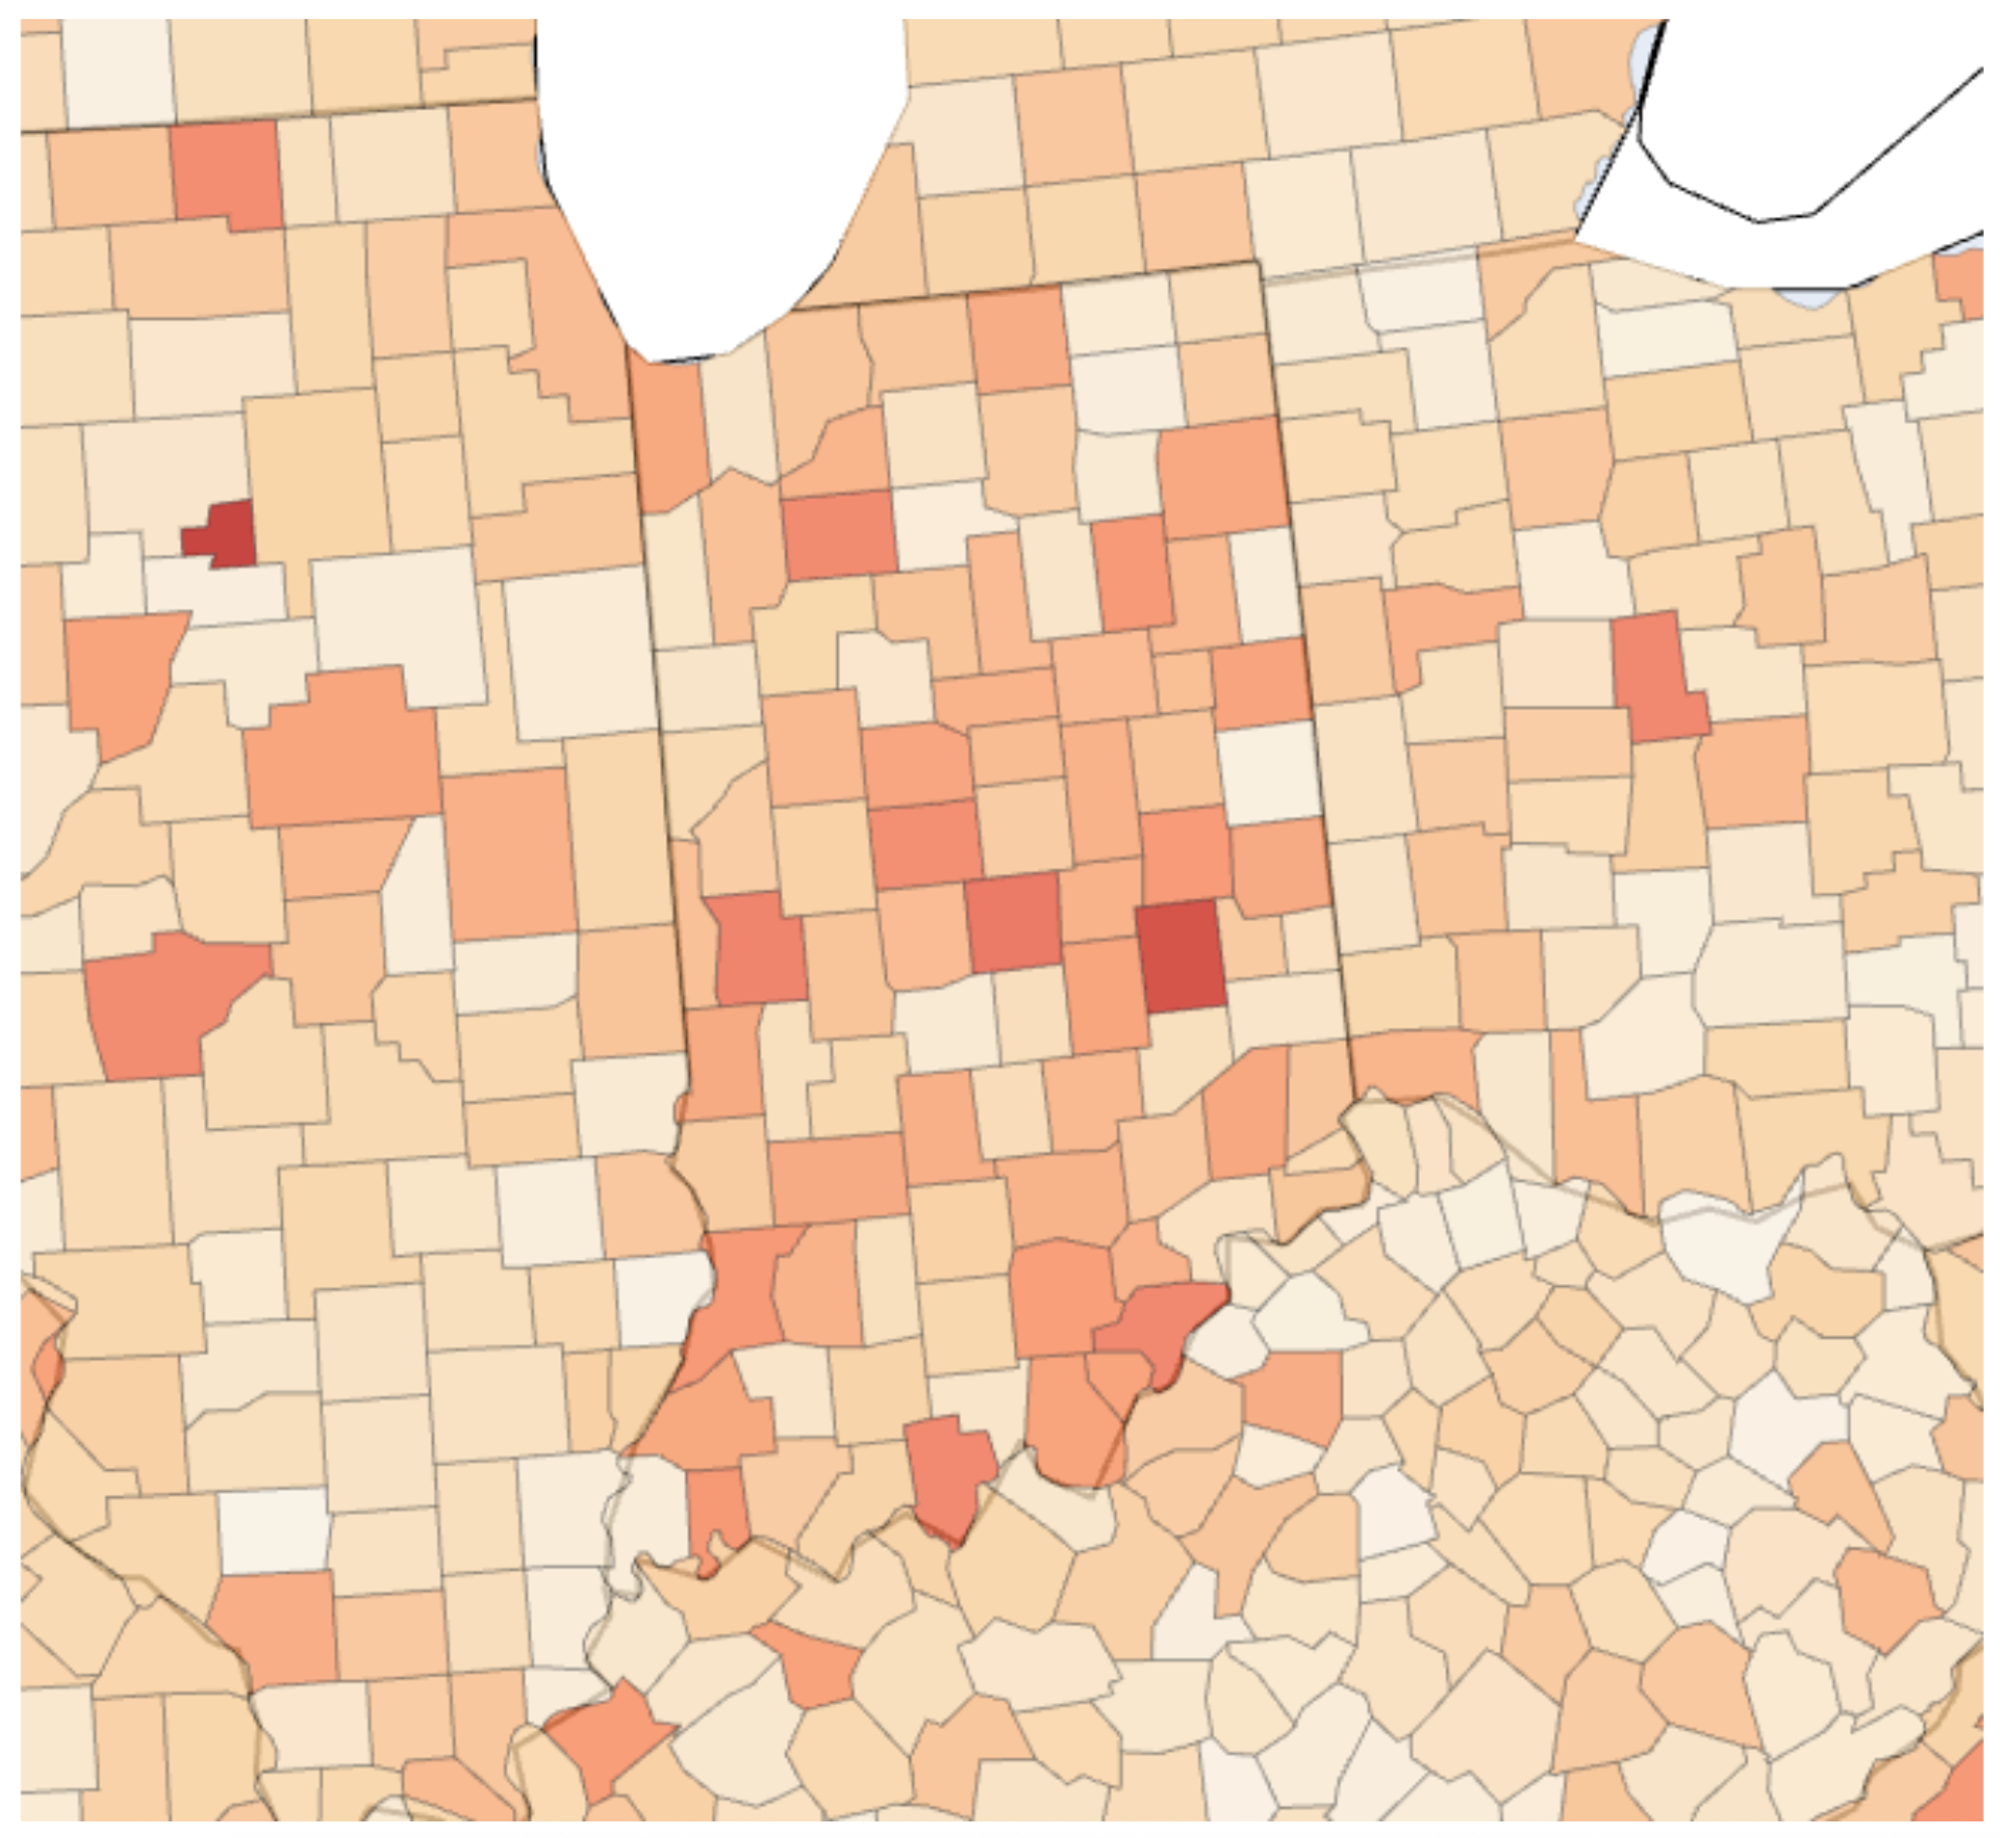
Indiana#indiana
After decreased theft rates in October and November, Indiana saw an increase in December; the December theft rate was comparable to the high rates seen in August and September 2025. Most liquidations happened at retailers purporting to be in Pennsylvania, New York, and New Jersey.
Nebraska#nebraska
In early January, Nebraska saw a sharp increase in unrecognized transactions. The volume of unrecognized transactions represents a vast increase over patterns of suspicious transactions in the recent past.
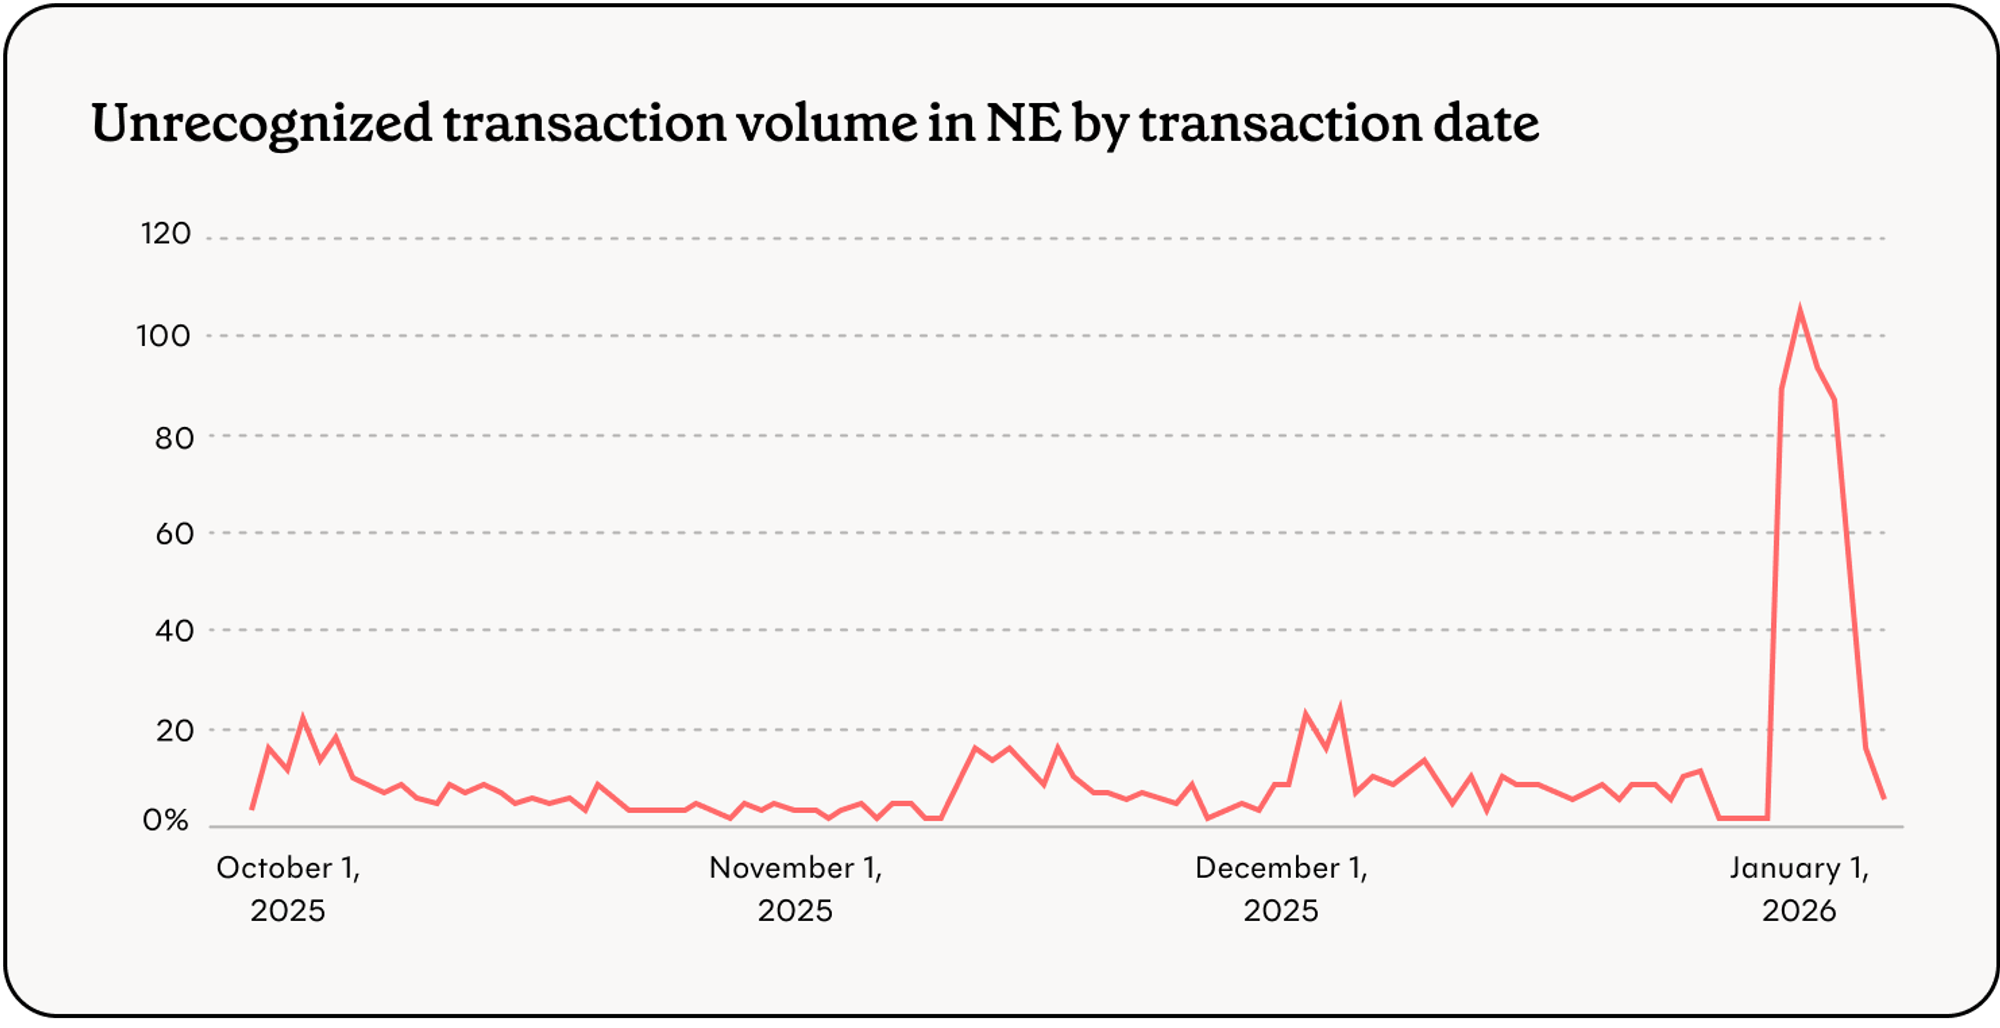
Unfortunately, Propel (and users) cannot see retailer names in the transaction history provided by the state’s online EBT portal. This makes it impossible to identify skimming and liquidation patterns through data aggregation, and impedes the ability of individual SNAP recipients to recognize and report theft.
Ongoing support#ongoing-support
Propel is committed to supporting state and federal agencies in protecting SNAP recipients from EBT theft. For questions about our methodology or further analysis, please contact gov@joinpropel.com.