Return to Propel's EBT Theft Hub
Summary
Propel data showed that overall EBT theft declined in Alabama, Utah, and Georgia, but Arkansas saw a sharp spike. Early July trends also flagged potential skimming in Nevada and rising theft in Oklahoma.
Propel’s fraud detection capabilities#propels-fraud-detection-capabilities
Propel serves over 5 million EBT cardholders nationwide who use our app to manage their benefits every month. We analyze transaction and customer-reported data to identify emerging patterns of EBT theft.
We generate these analyses early in the month, when theft activity typically peaks following SNAP benefit deposits. Our data reflects real theft activity, but may show a slight upward bias since cardholders are more likely to check the app after experiencing theft. Given the rapidly evolving nature of EBT theft, our insights represent a current snapshot rather than a comprehensive assessment.
June 2025 theft patterns#june-2025-theft-patterns
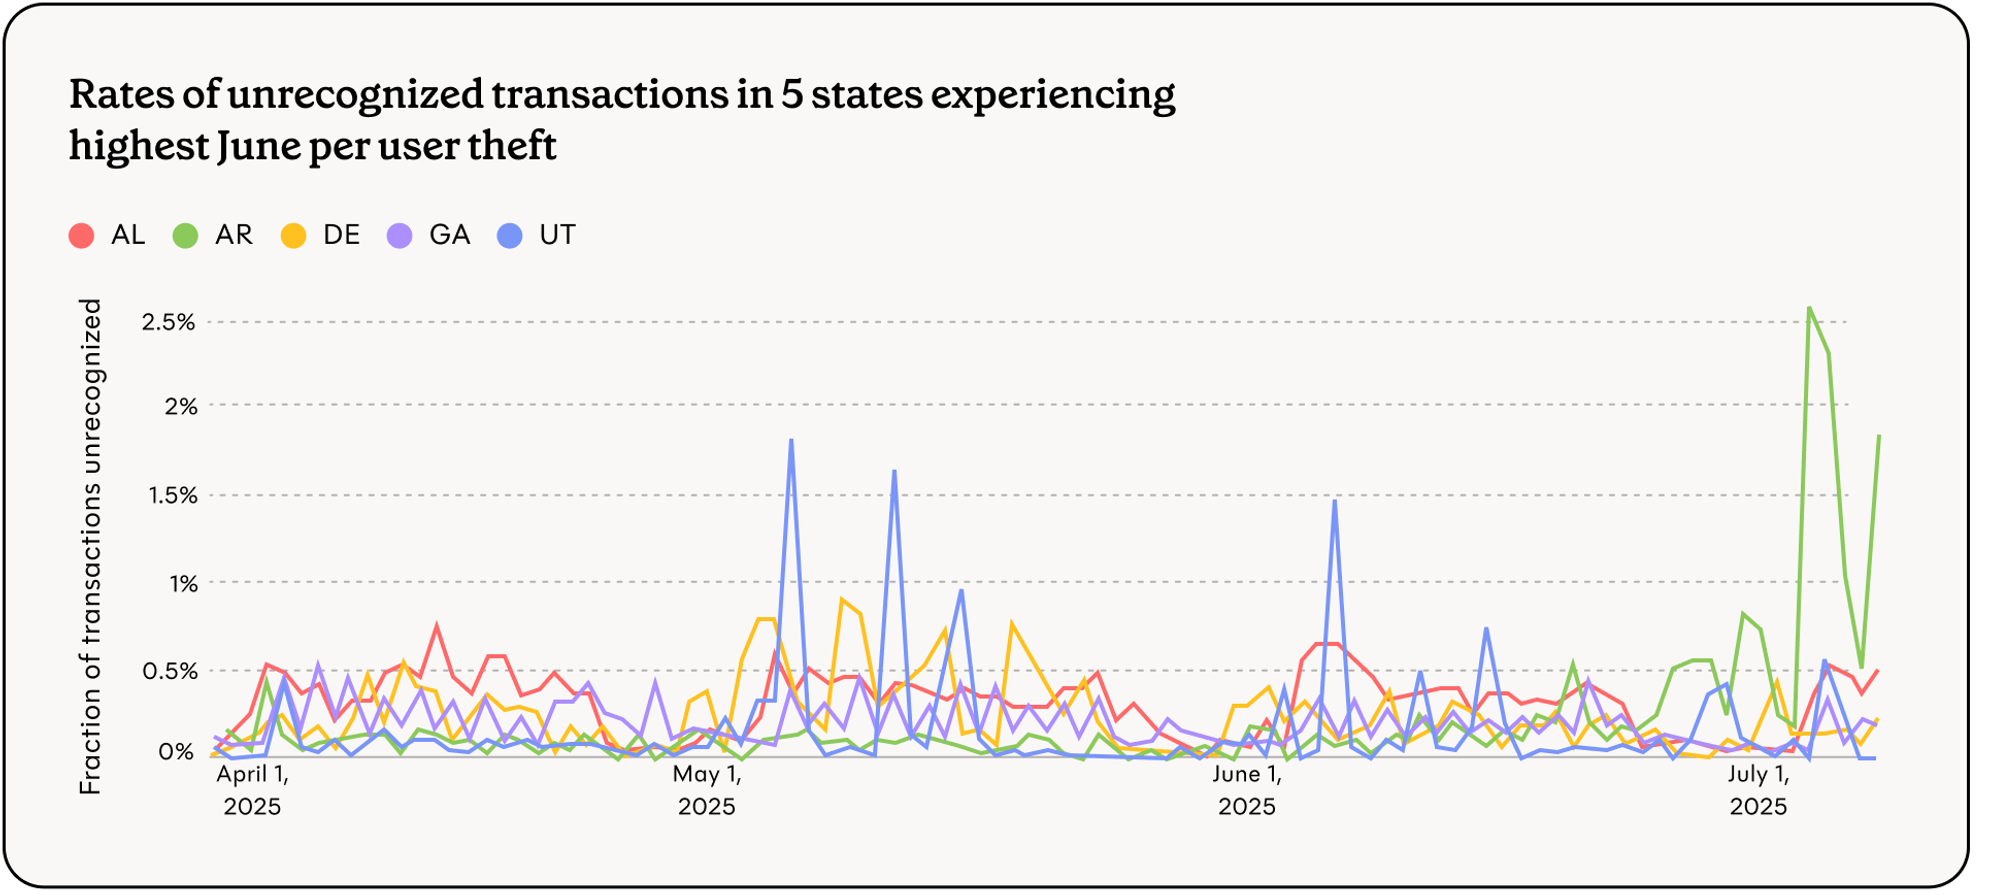
As in May, the four states with the most per user theft in June were Alabama, Utah, Delaware, and Georgia. However, all four states saw a decrease in overall rate of reported theft from May to June.
| Rank | April 2025 | May 2025 | June 2025 |
|---|---|---|---|
| 1 | AL (0.35%) | DE (0.38%) | AL (0.31%) |
| 2 | GA (0.24%) | AL (0.32%) | UT (0.20%) |
| 3 | IN (0.23%) | UT (0.28%) | DE (0.17%) |
| 4 | SC (0.22%) | GA (0.20%) | GA (0.17%) |
| 5 | VA (0.20%) | NY (0.19%) | AR (0.17%) |
The most notable change this month is Arkansas: the unrecognized transaction rate increased from 0.07% to 0.17% from May to June and has continued to rise through early July.
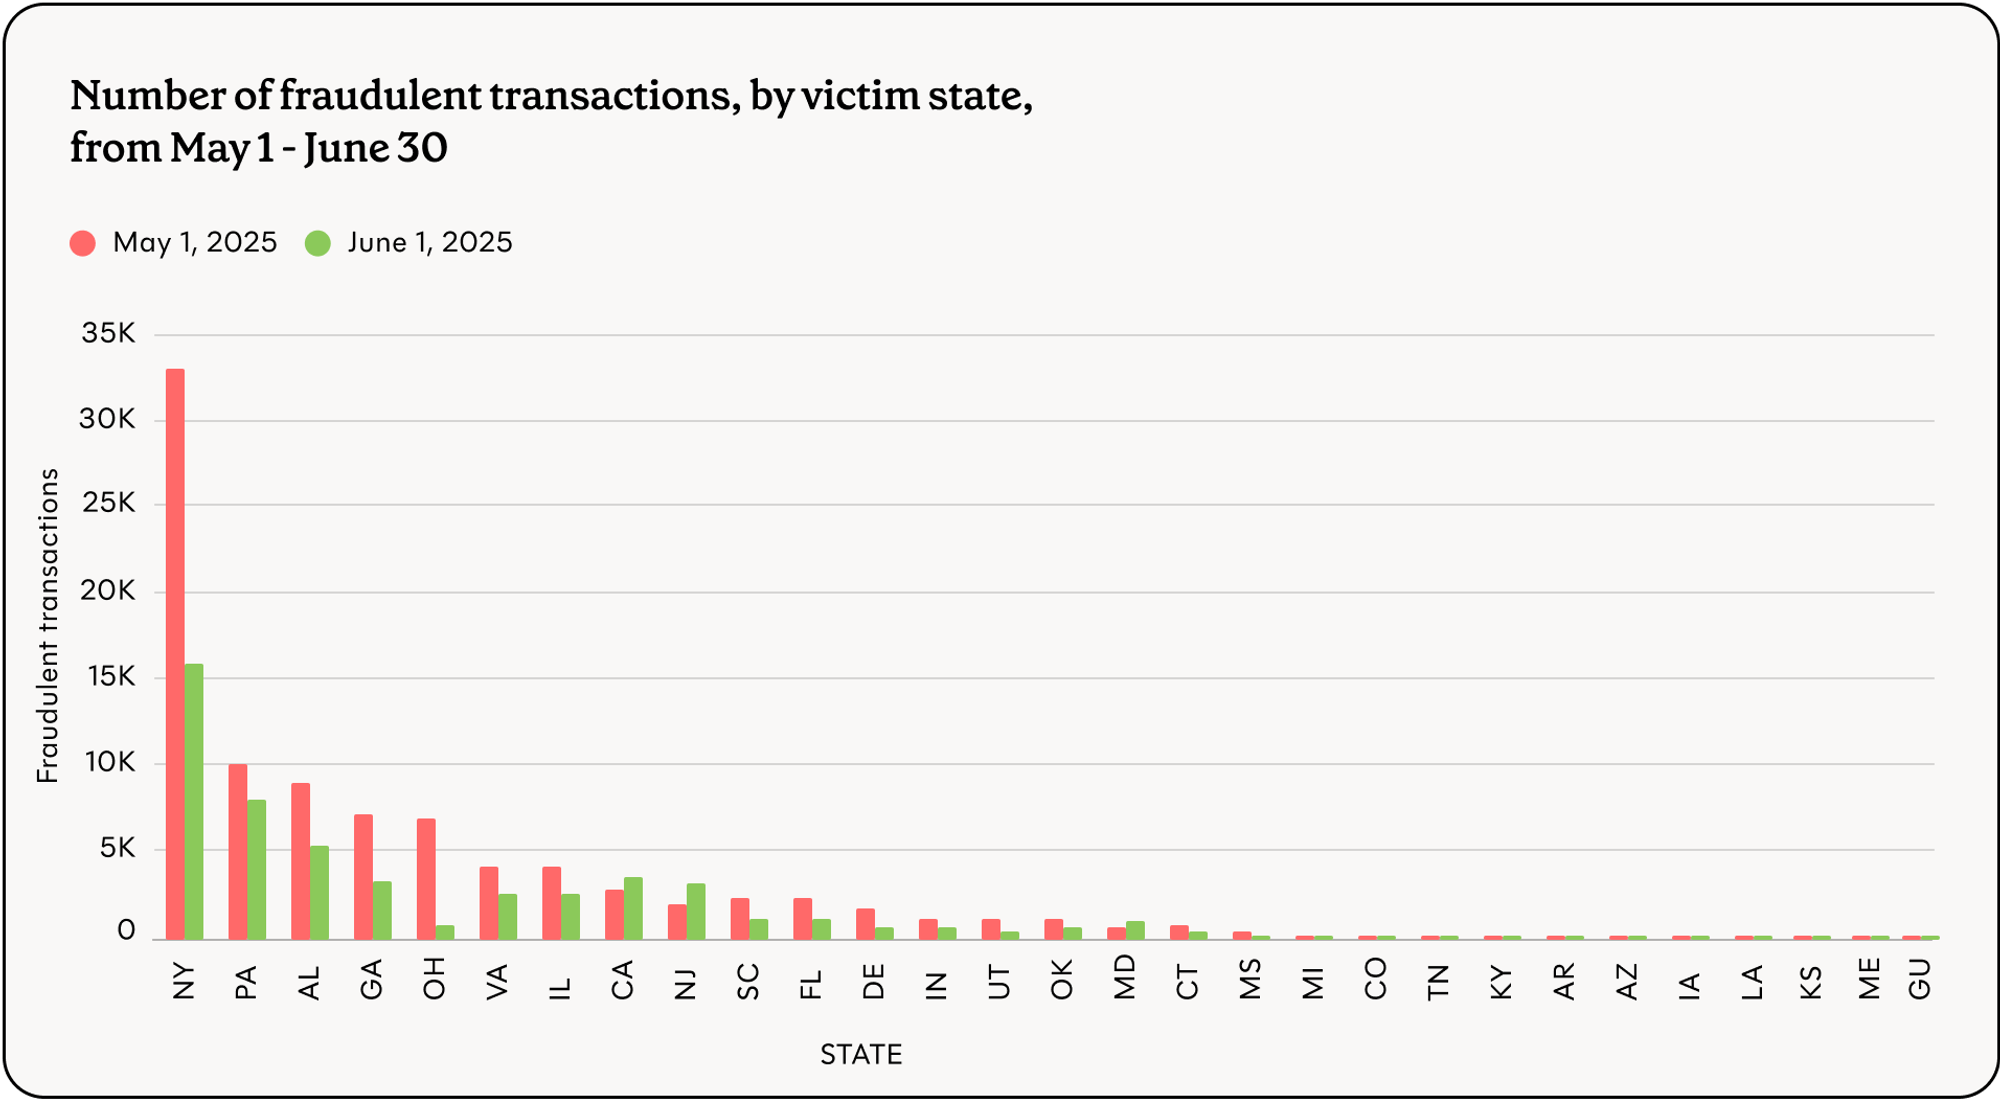
Despite Arkansas’ rising per user theft, New York still has the most theft by transaction volume (followed by Pennsylvania and Alabama). California has the fourth-most theft by transaction volume, most of which is cash benefits theft rather than SNAP.
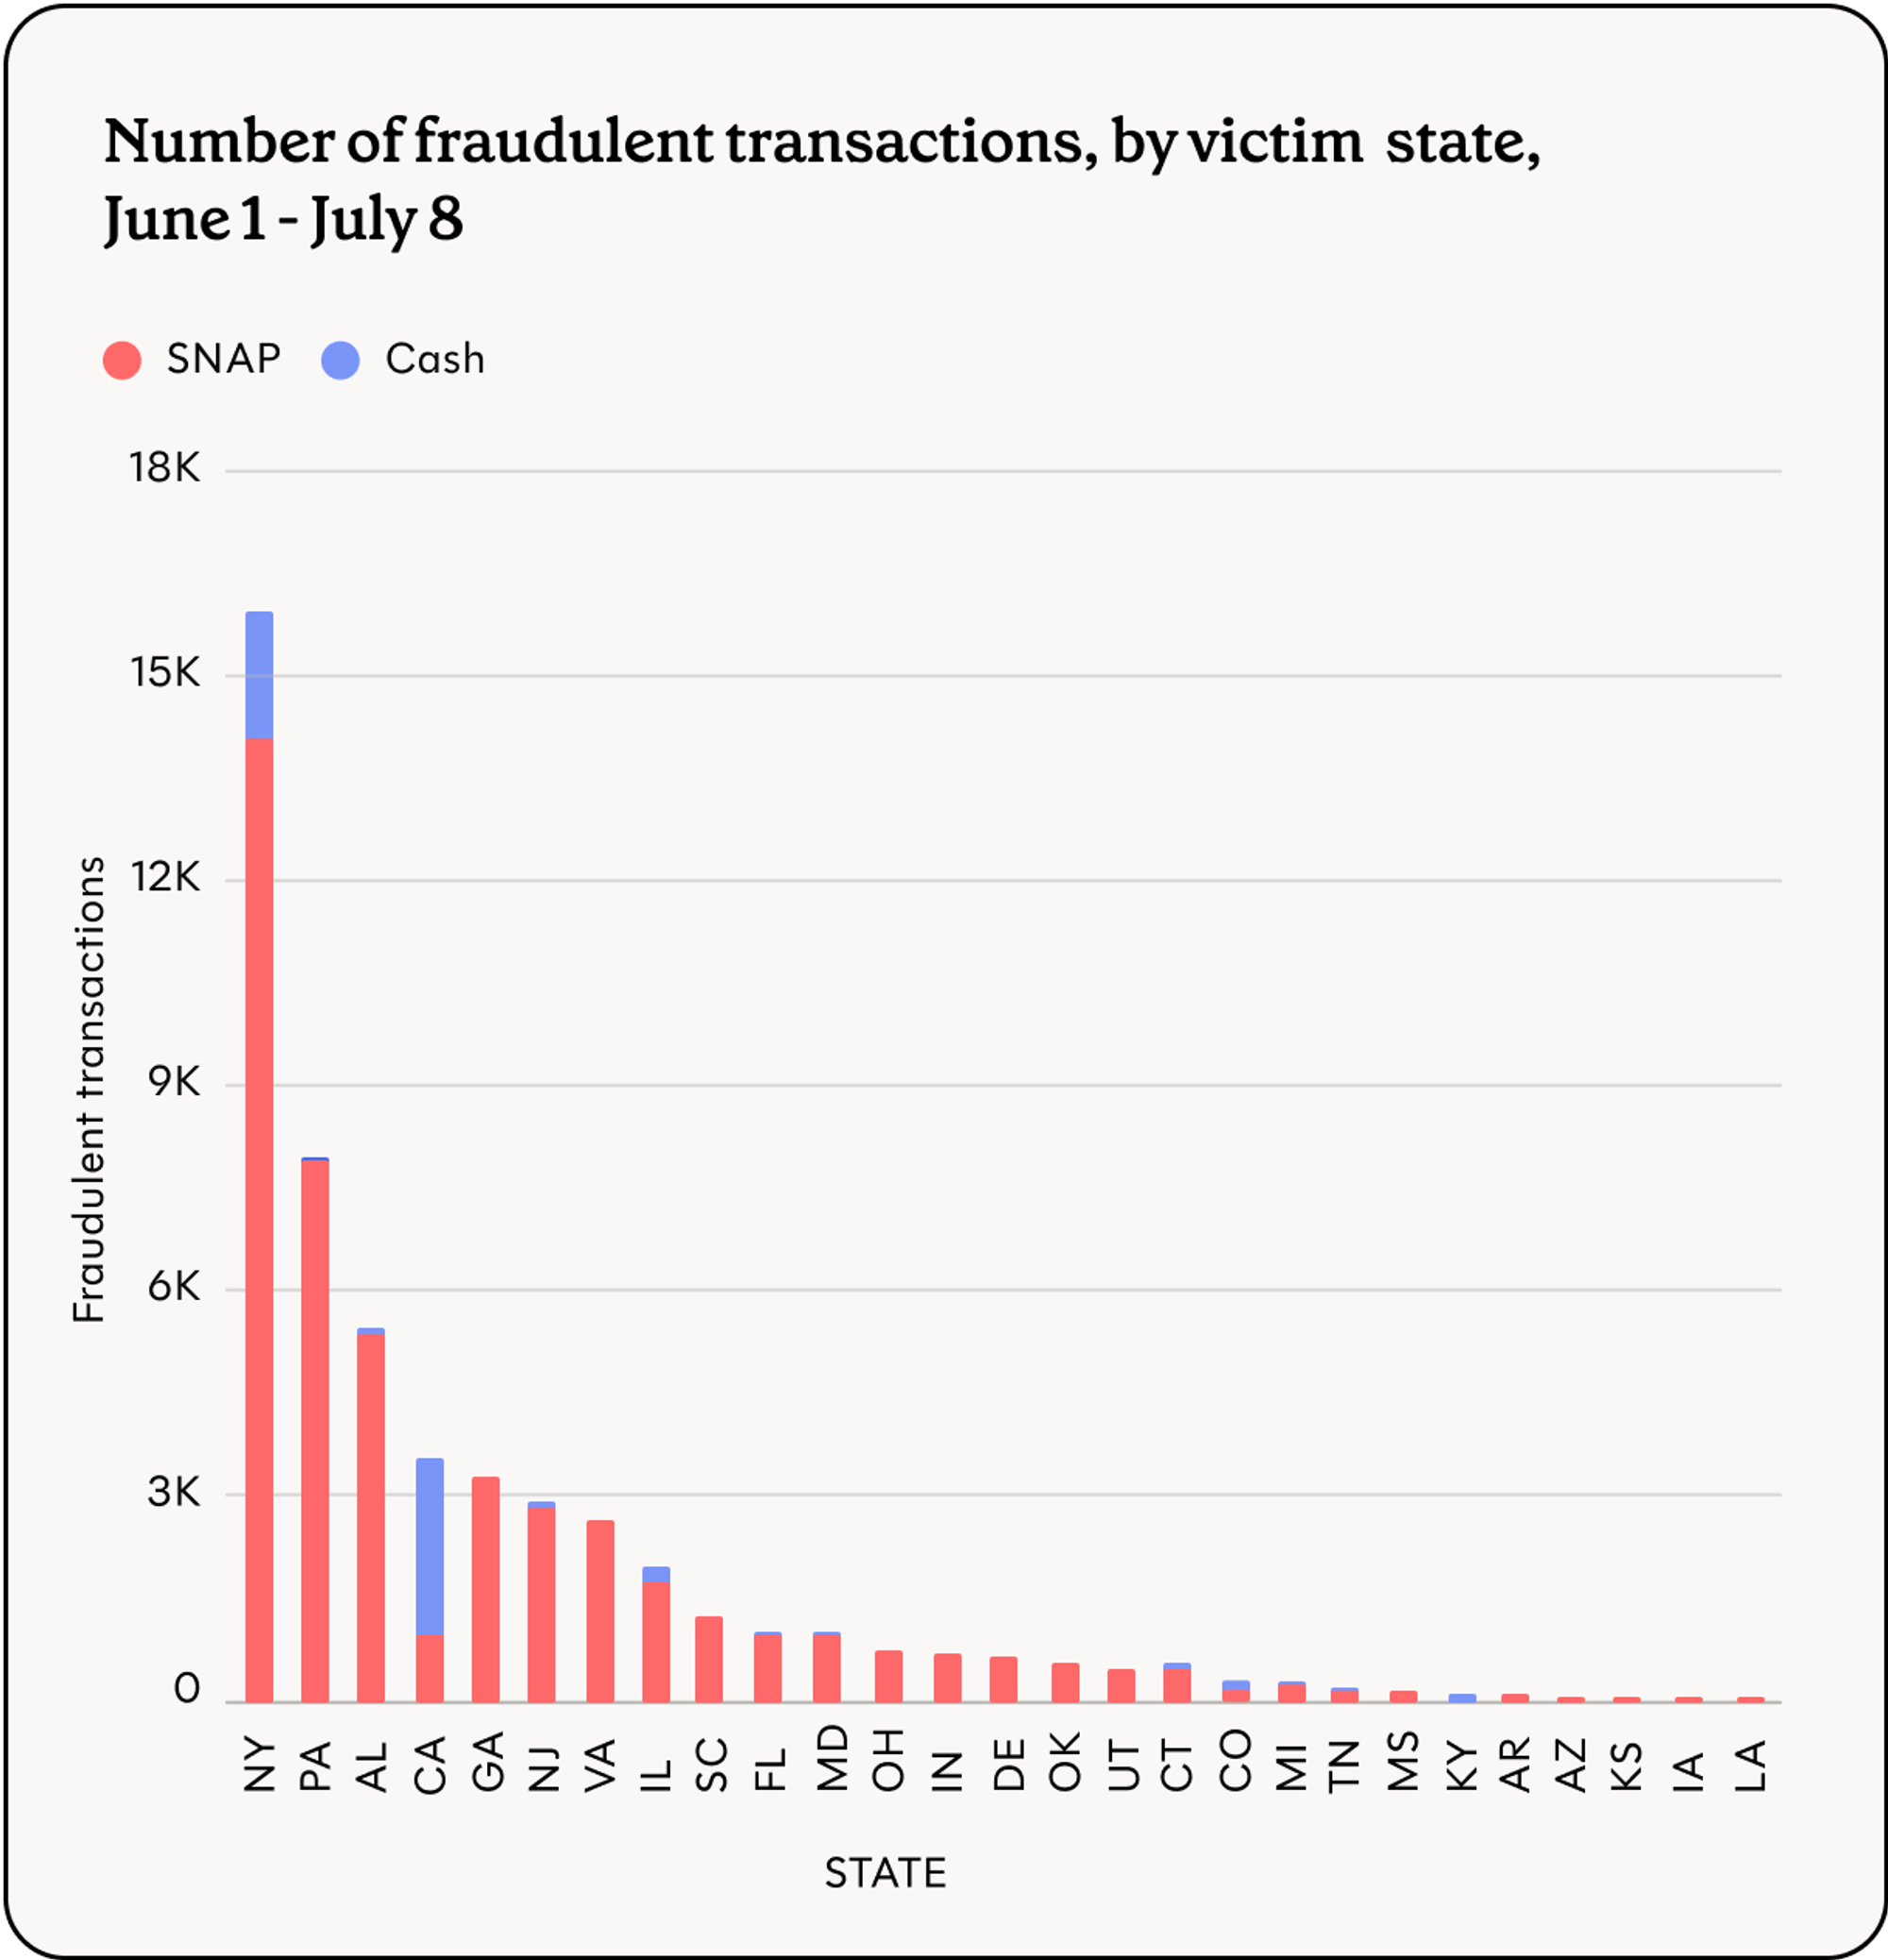
While New York continues to lead the nation in theft by volume, it is worth nothing that theft in the state has decreased since May (by volume and rate).
Early July 2025 theft patterns#early-july-2025-theft-patterns
Arkansas#arkansas
While the increase in Arkansas theft from May to June is significant, early July trends are particularly concerning. The graph below shows the fraction of transactions marked unrecognized by users. The large green spikes in early July are on the 4th, 5th, and 8th – the first three deposit days for Arkansas SNAP benefits. This July spike far surpasses states with the highest June theft rates.
Fraudulent transactions are largely at apparent retailers claiming to be small stores in Newark, NJ, and Philadelphia, PA. As of today, Arkansas is one of six states that does not allow users to block out of state transactions or lock their cards.
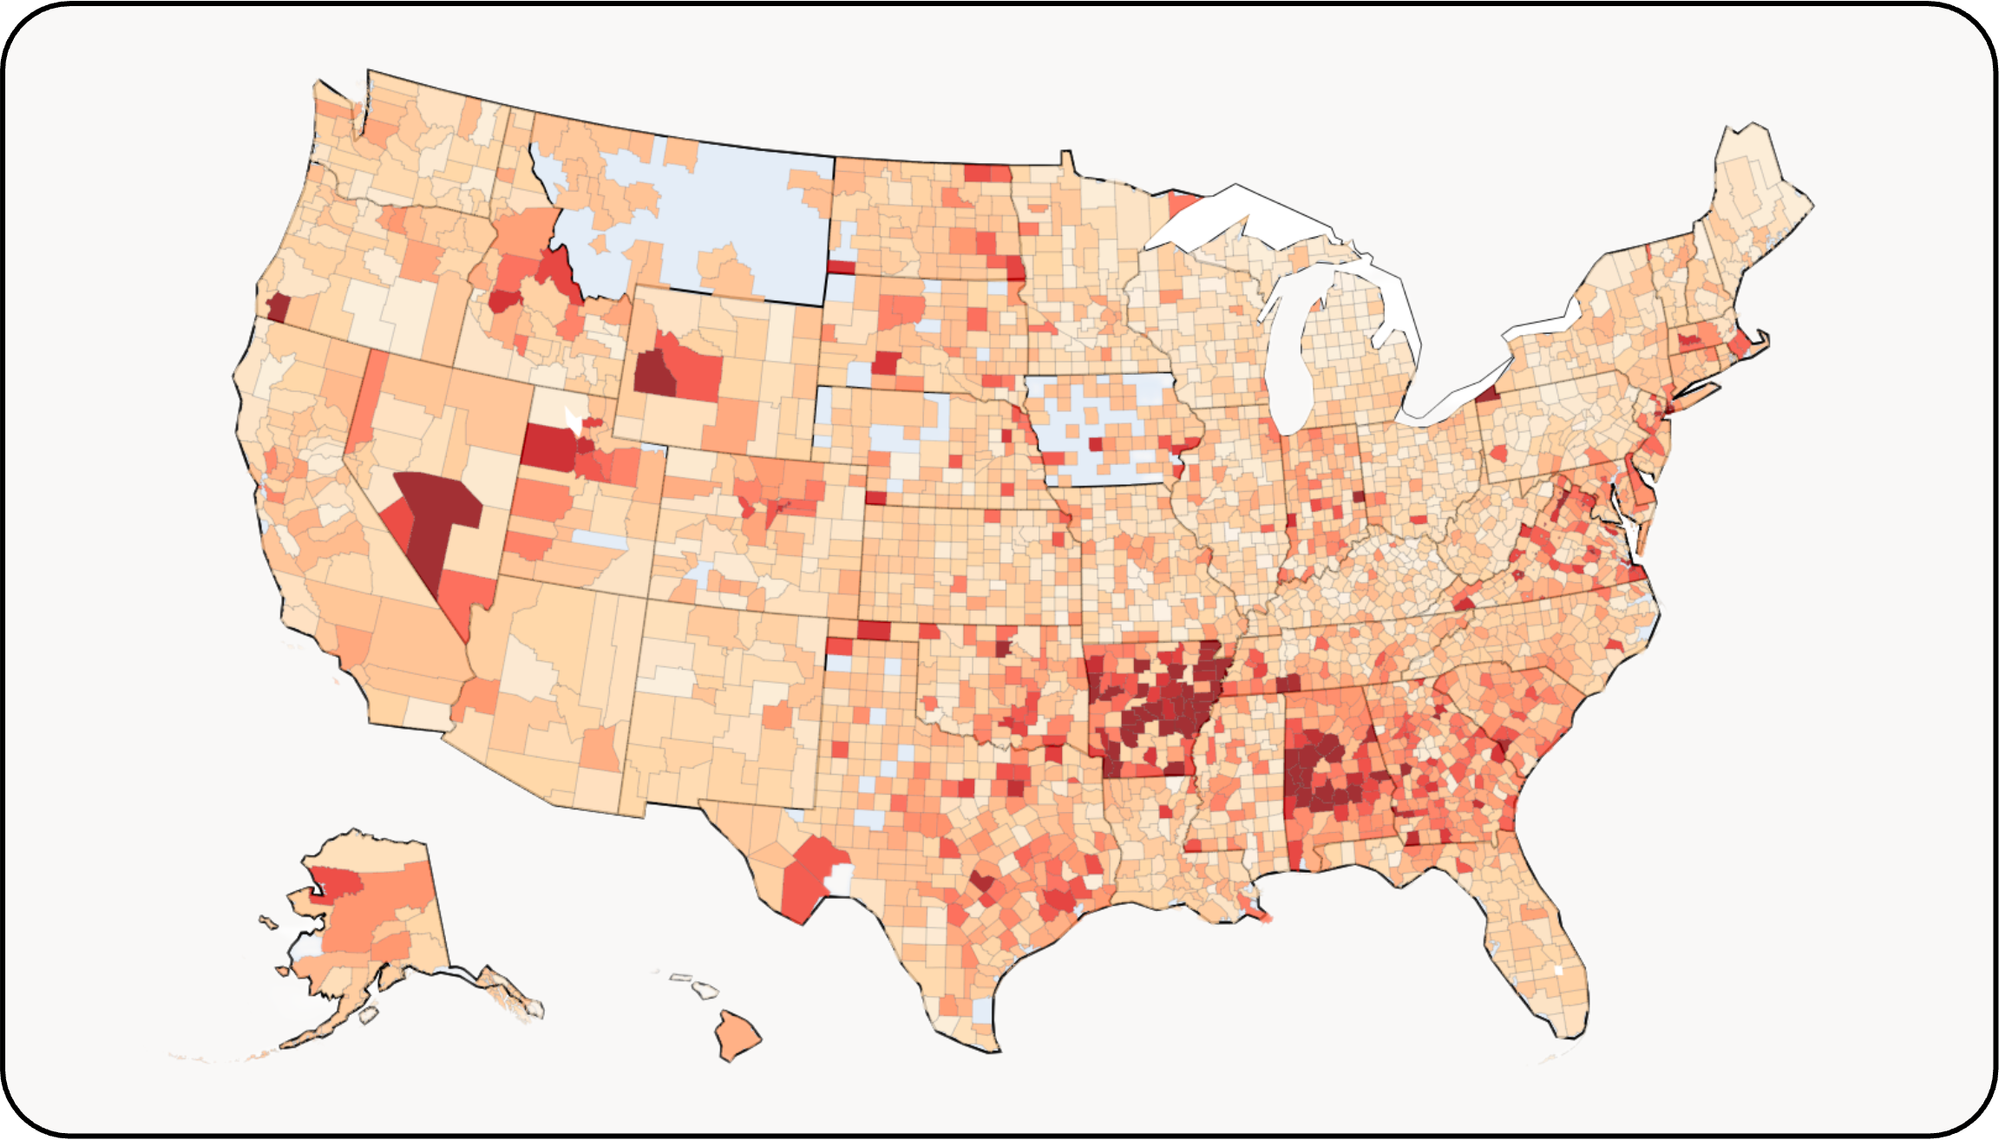
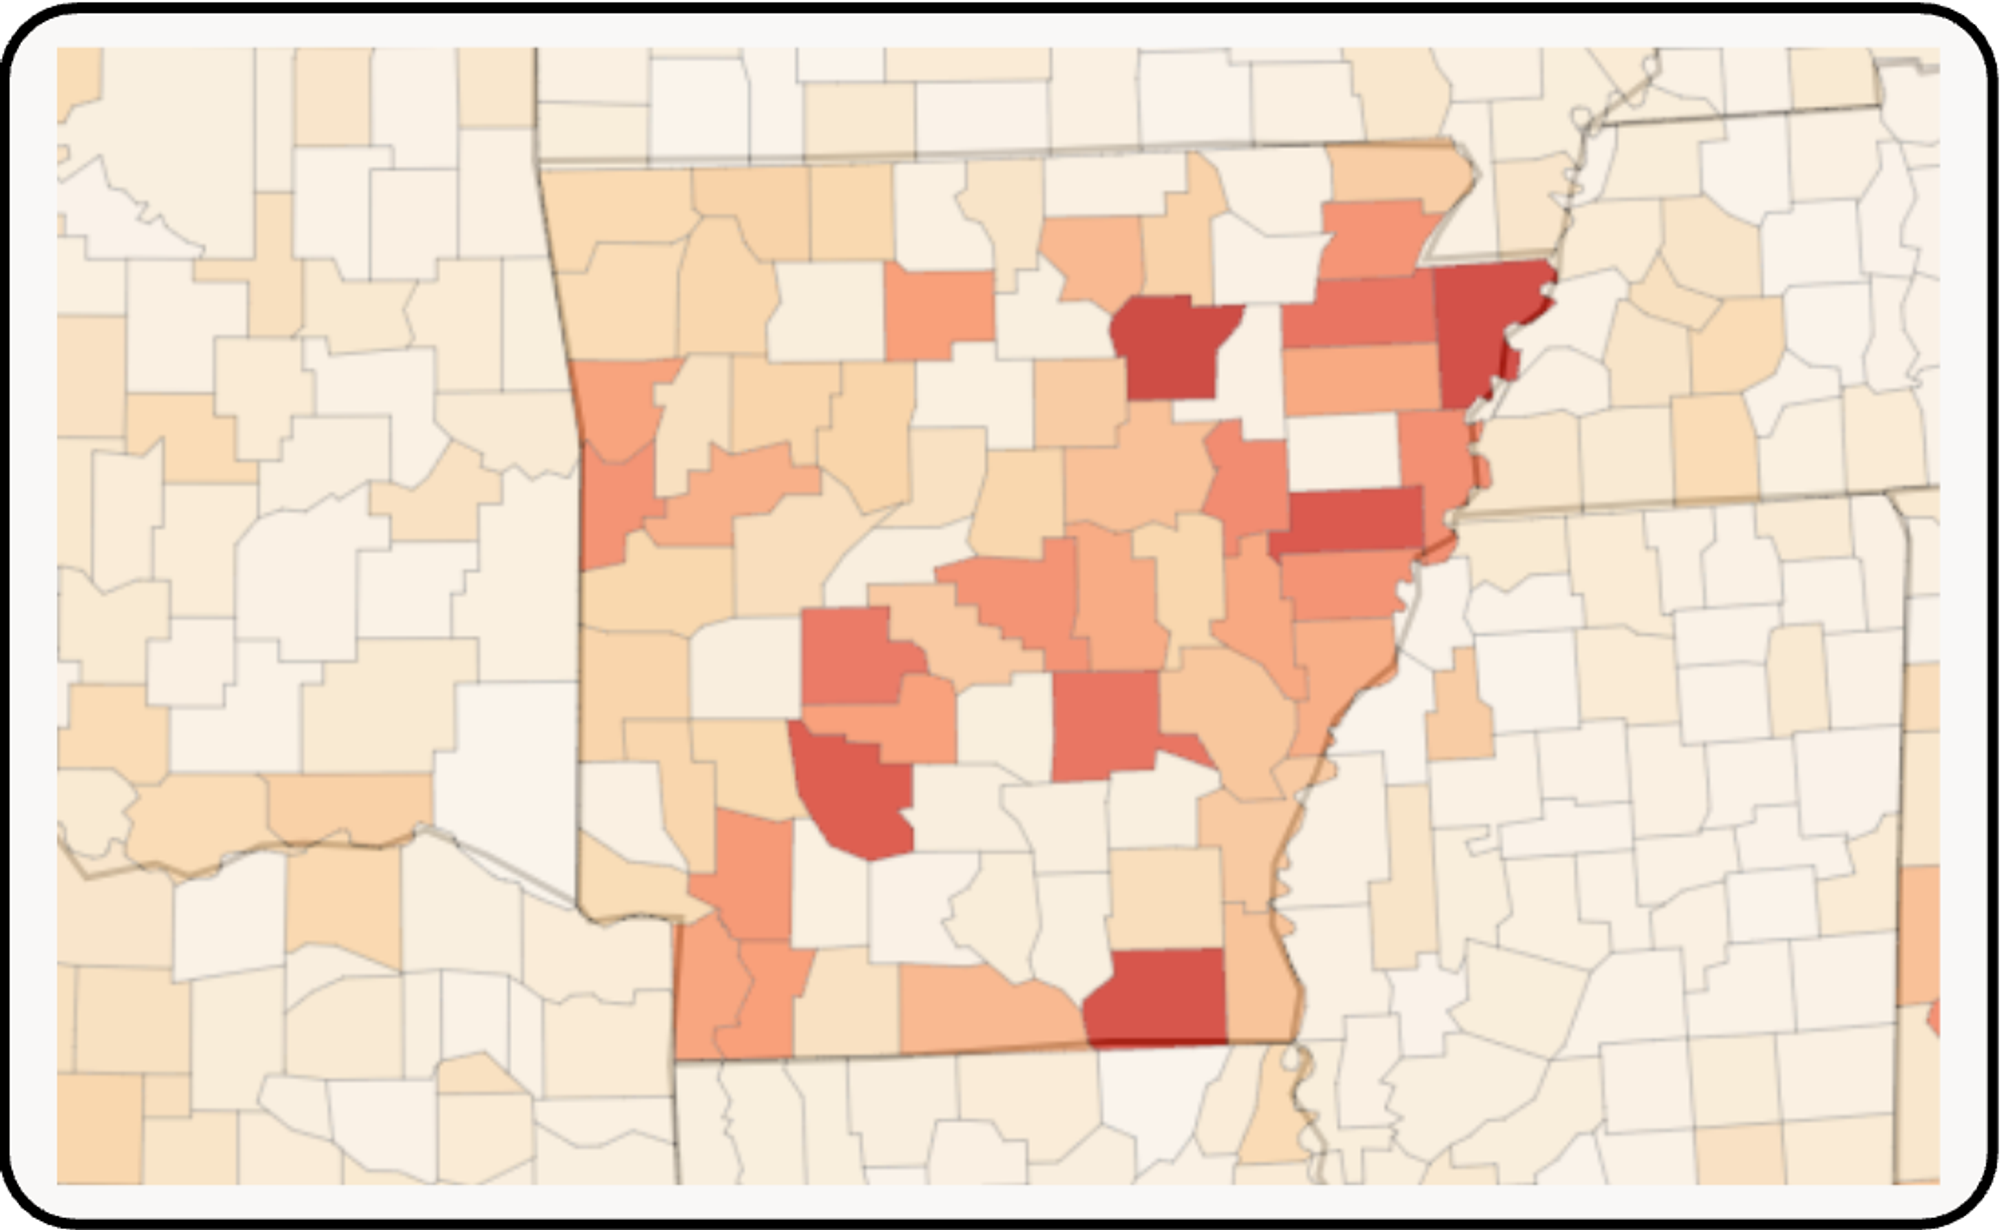
Users throughout the state have experienced theft, but it is concentrated in the southwest and northeast. However, there is not yet clear evidence of specific skimmers – this may change in July as theft is likely to continue spiking on SNAP deposit days and more data arrives.
Other states#other-states
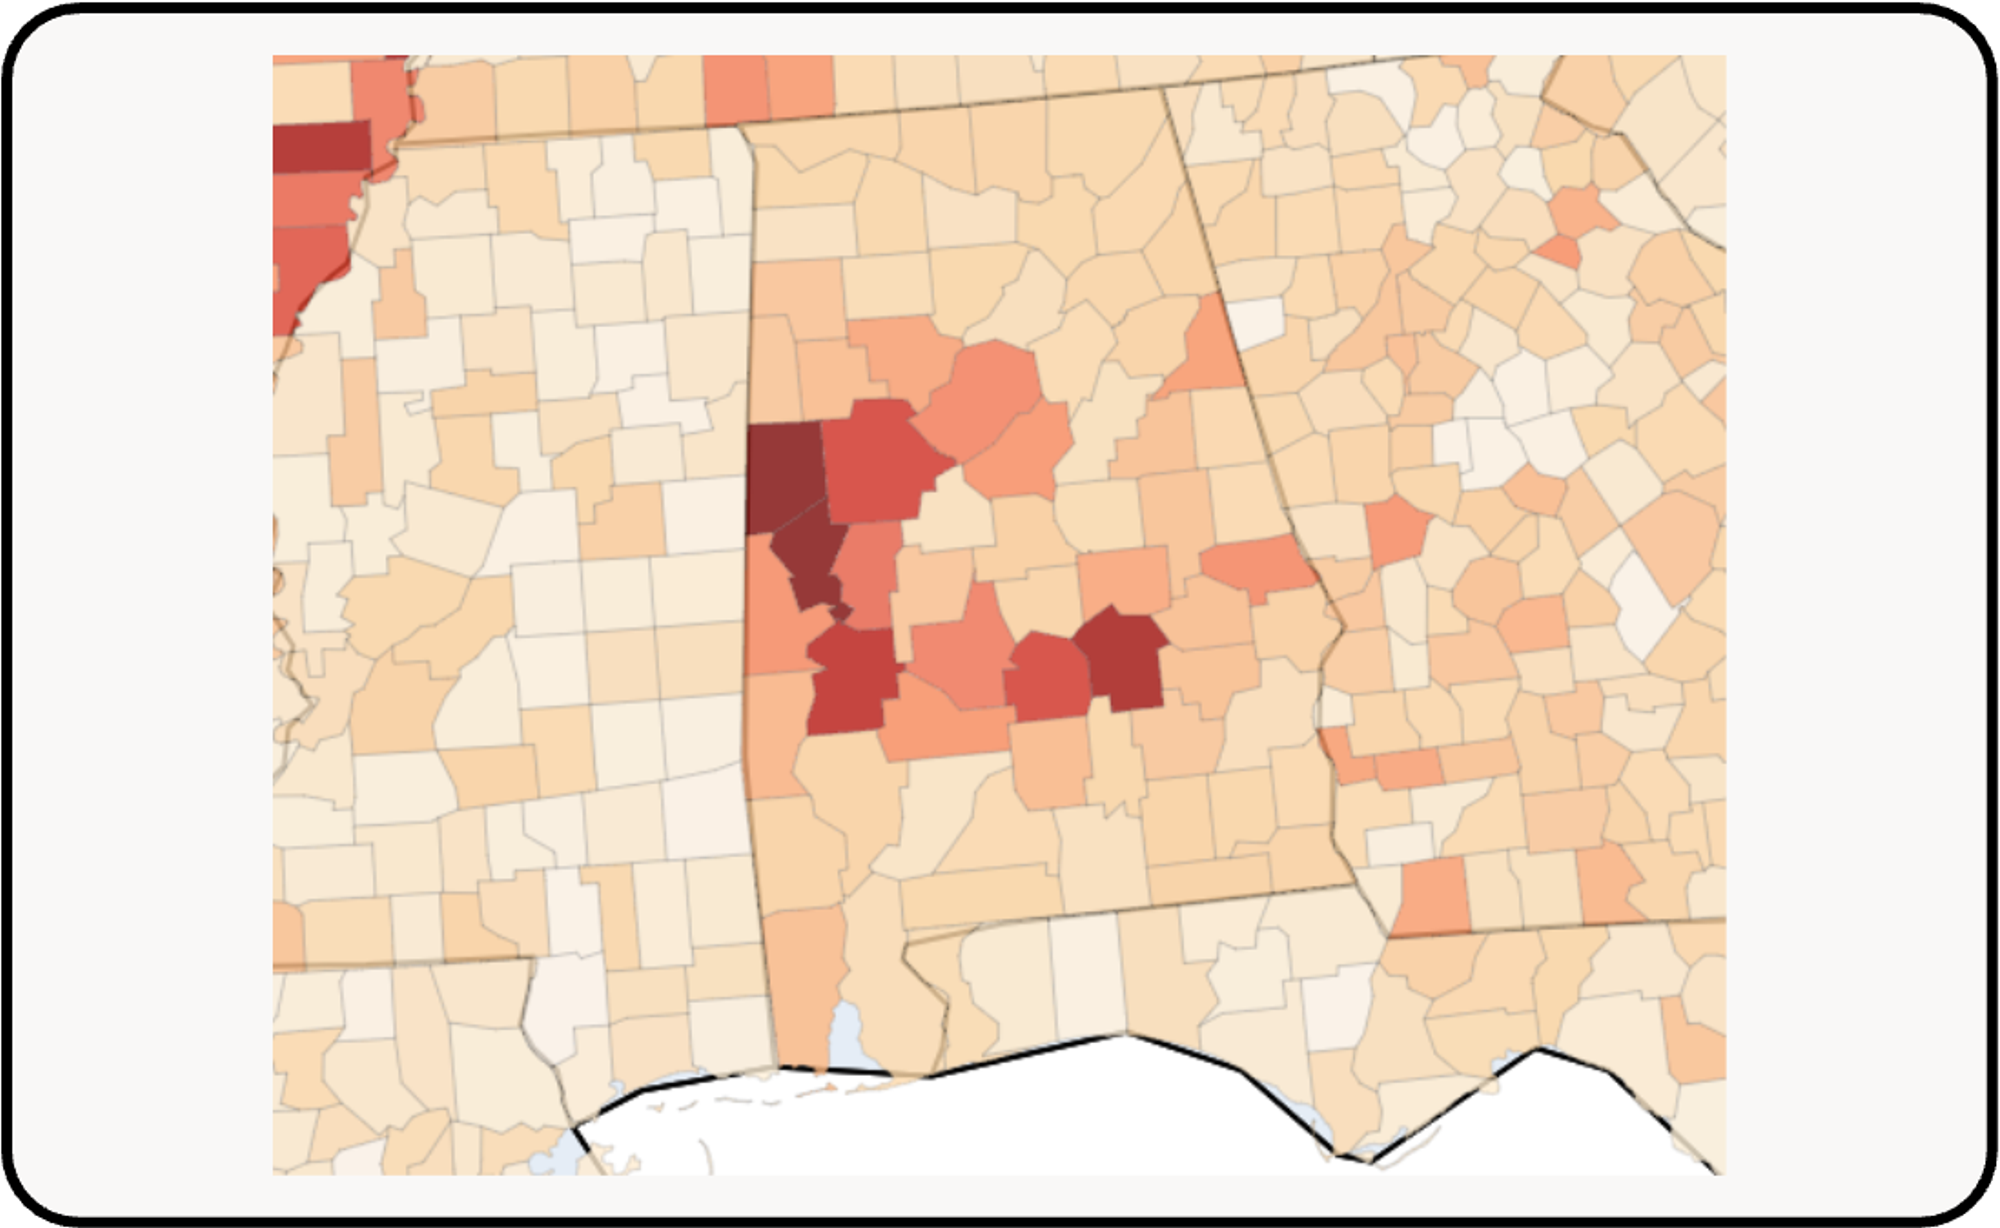
Alabama per user theft saw little change month over month. Unrecognized transactions remain largely in the Selma and Tuscaloosa areas.
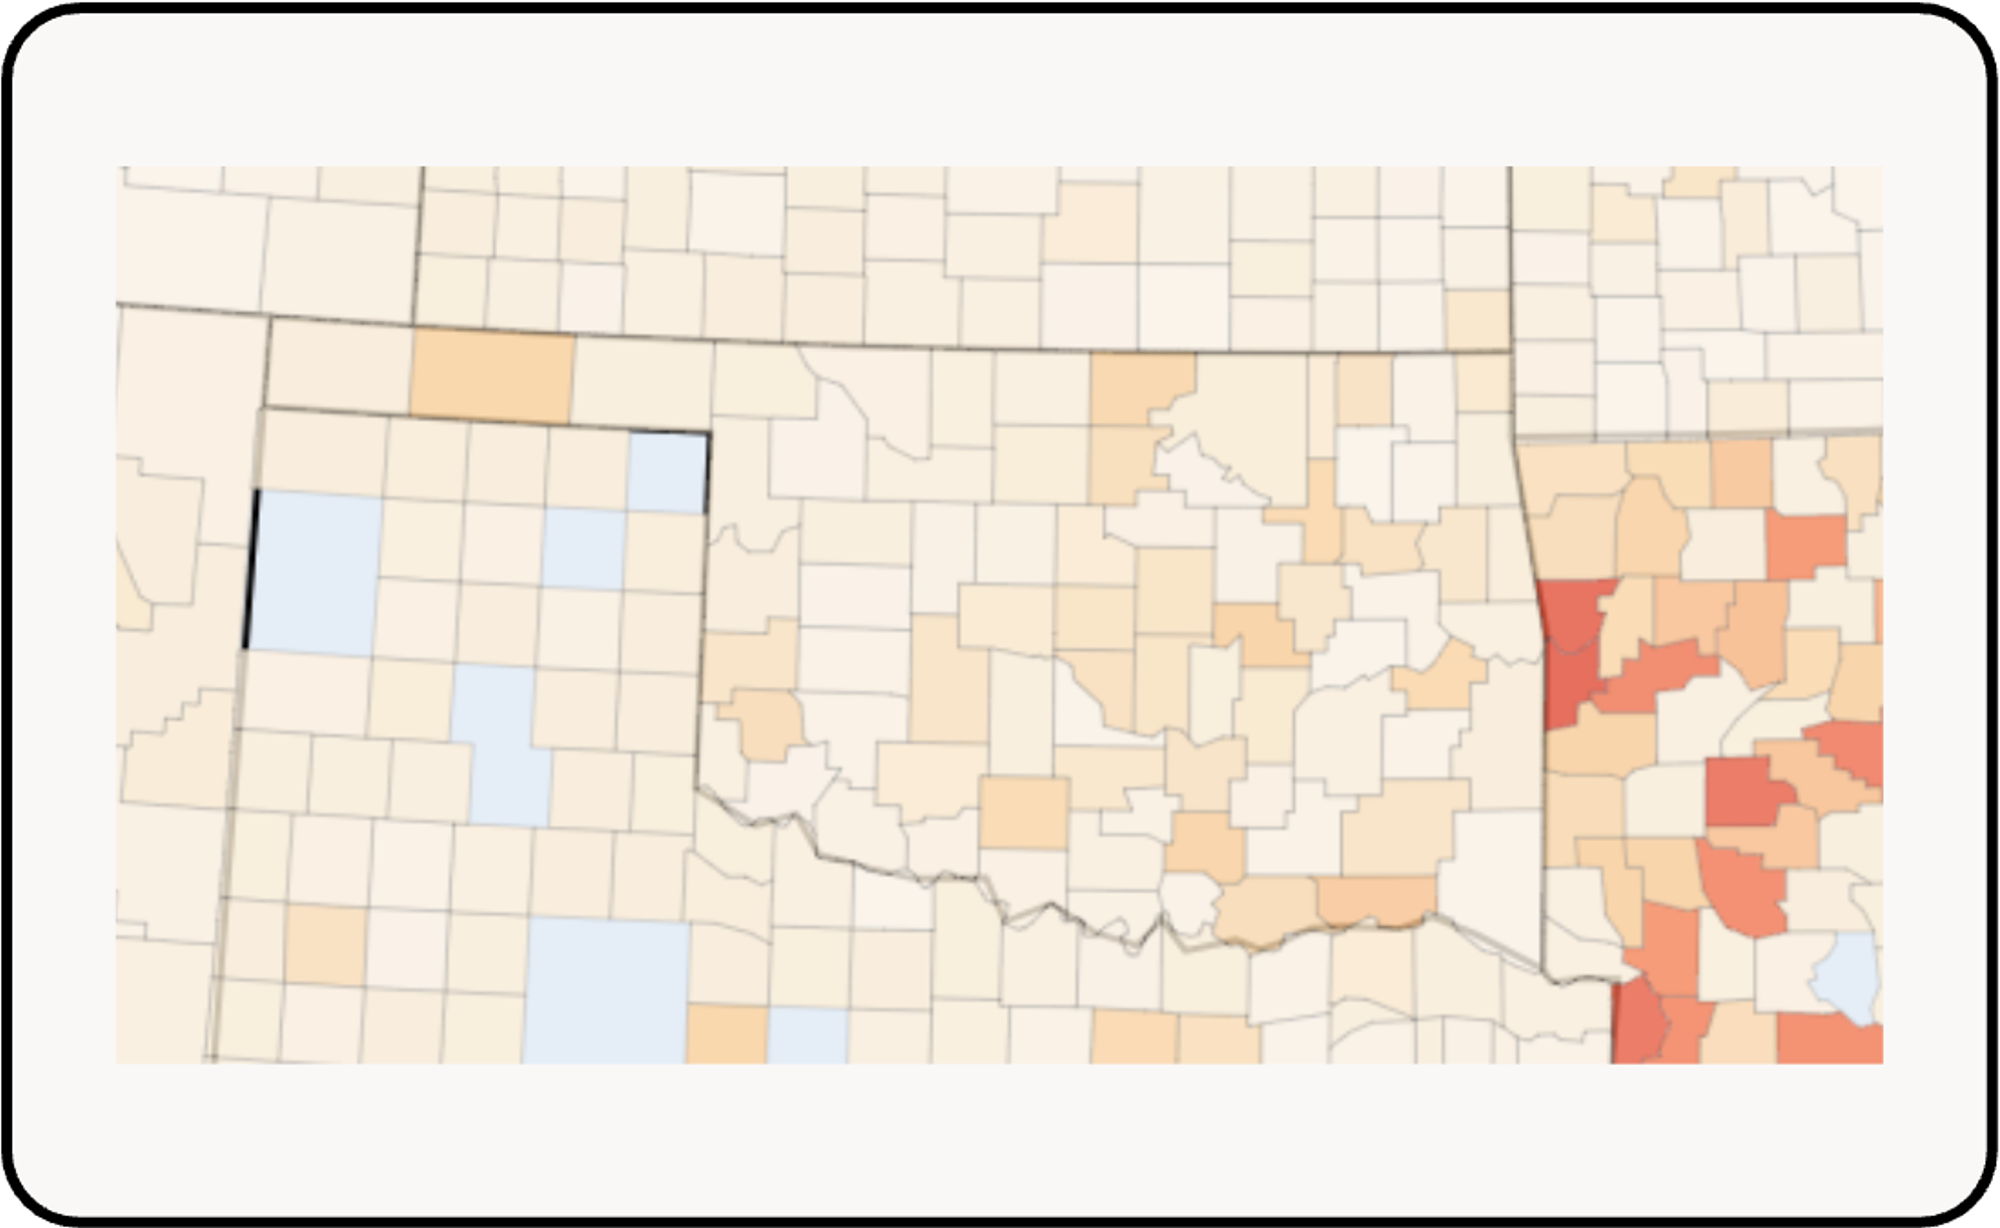
Nevada and Oklahoma have seen spikes in unrecognized transactions in the first week of July. Oklahoma saw similar spikes in early April, but has not seen particularly high theft levels between then and now.
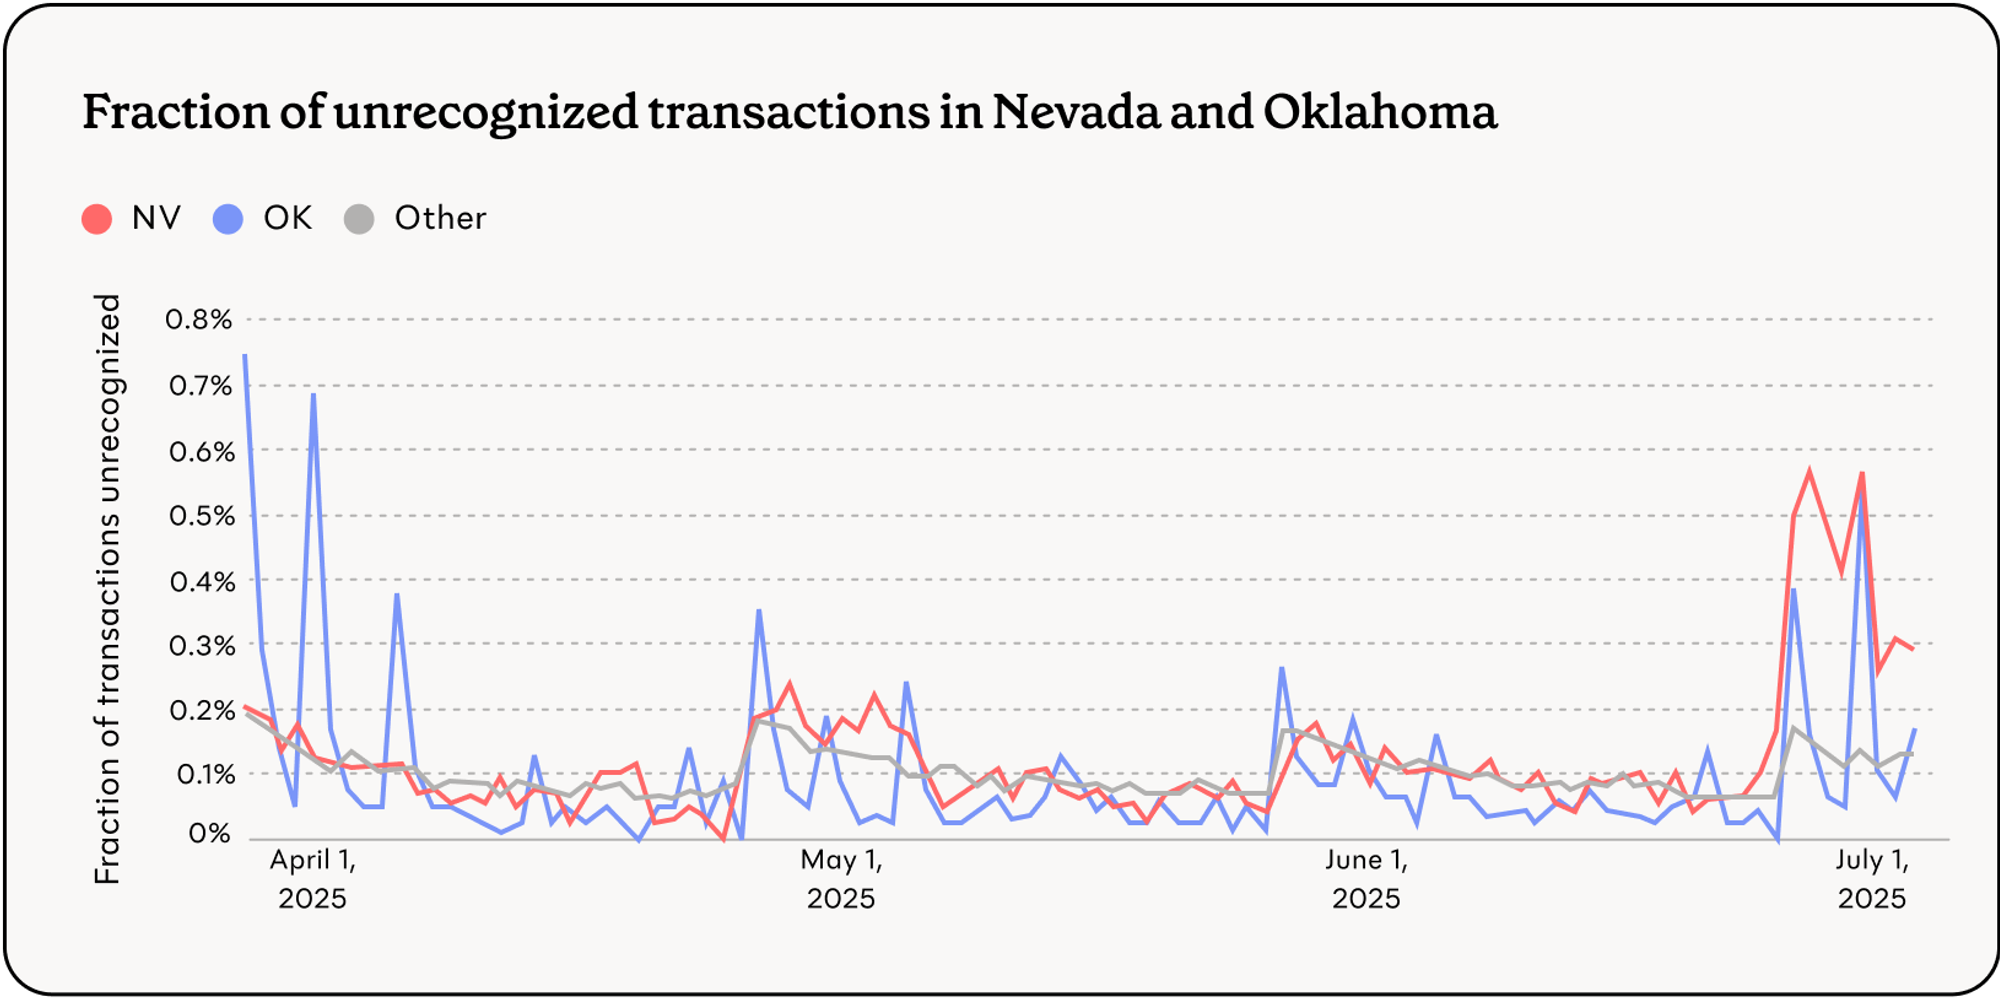
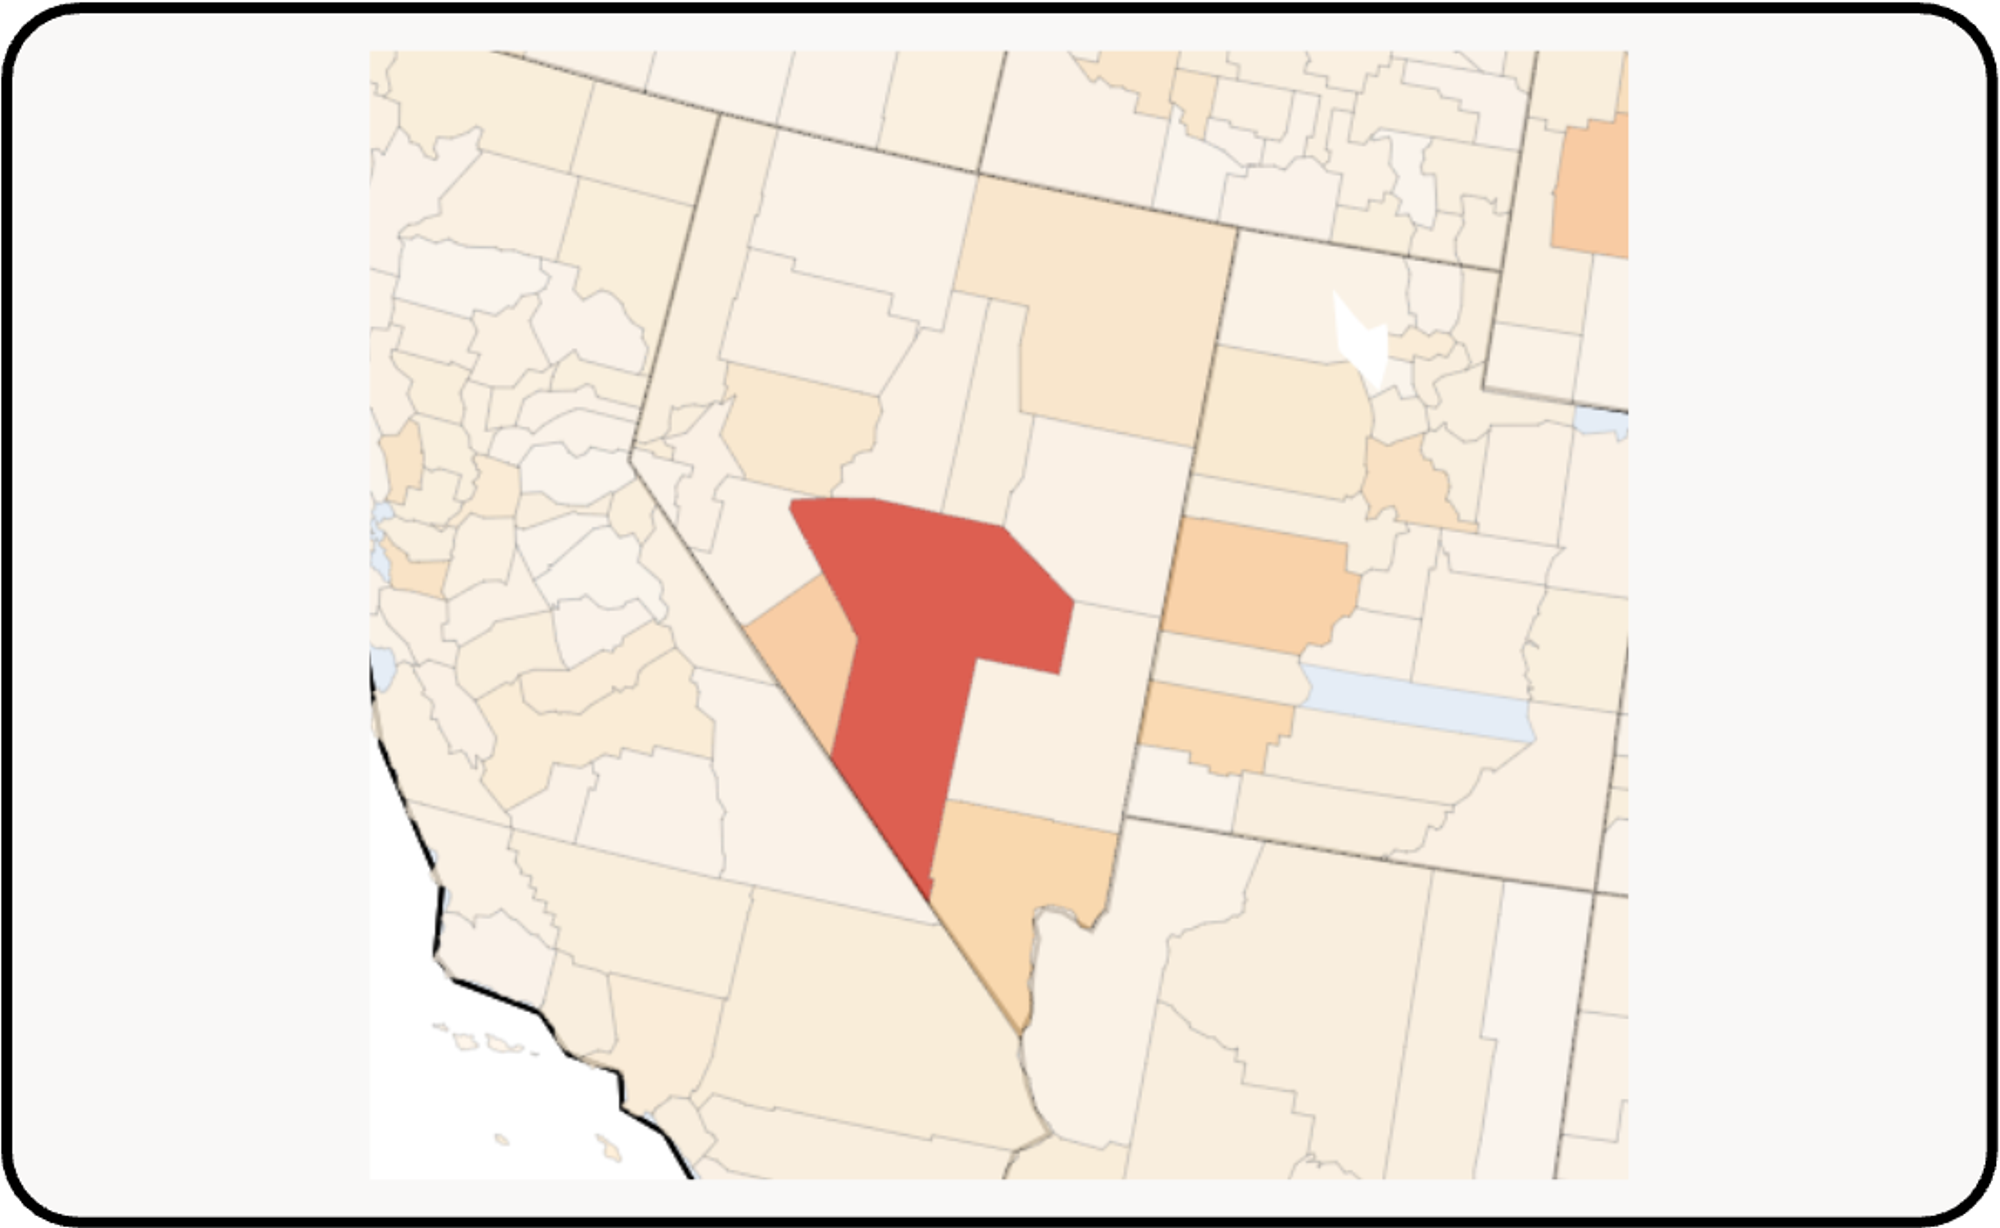
Nevada shows early signs of skimming: unrecognized tap rate is particularly elevated in Nye County and higher than normal in nearby Clark county.
Oklahoma does not show clear evidence of skimming. While impacted users are spread throughout the state, the pattern does not yet indicate a state-level data compromise.
Propel is committed to supporting state and federal agencies in protecting SNAP recipients from EBT theft. For questions about our methodology or further analysis, please reach out to Justin King (justin@joinpropel.com).