February 2026 Pulse Survey
Our editorial promise
All of our Propel editorial content meets our high bar for accuracy, timeliness, trust, and relevance. Our pages are edited and fact-checked to make sure we meet our mission of giving you information you can rely on.
Learn more about our editorial standards.


Table of contents
Summary
Food security gains appear to be stalling as short-term hardship ticks up and a record share of households report having almost no cash on hand. Rising debt, increased reliance on short-term credit, and benefit disruptions tied to new work requirement notices point to mounting financial instability for SNAP households.
The following insights come from a <10-minute multiple choice and open response survey conducted by Propel. This month, responses came from 5,309 randomly selected households out of more than 5 million Propel users from February 9 – 11, 2026. All respondents are EBT cardholders.
Food insecurity#food-insecurity
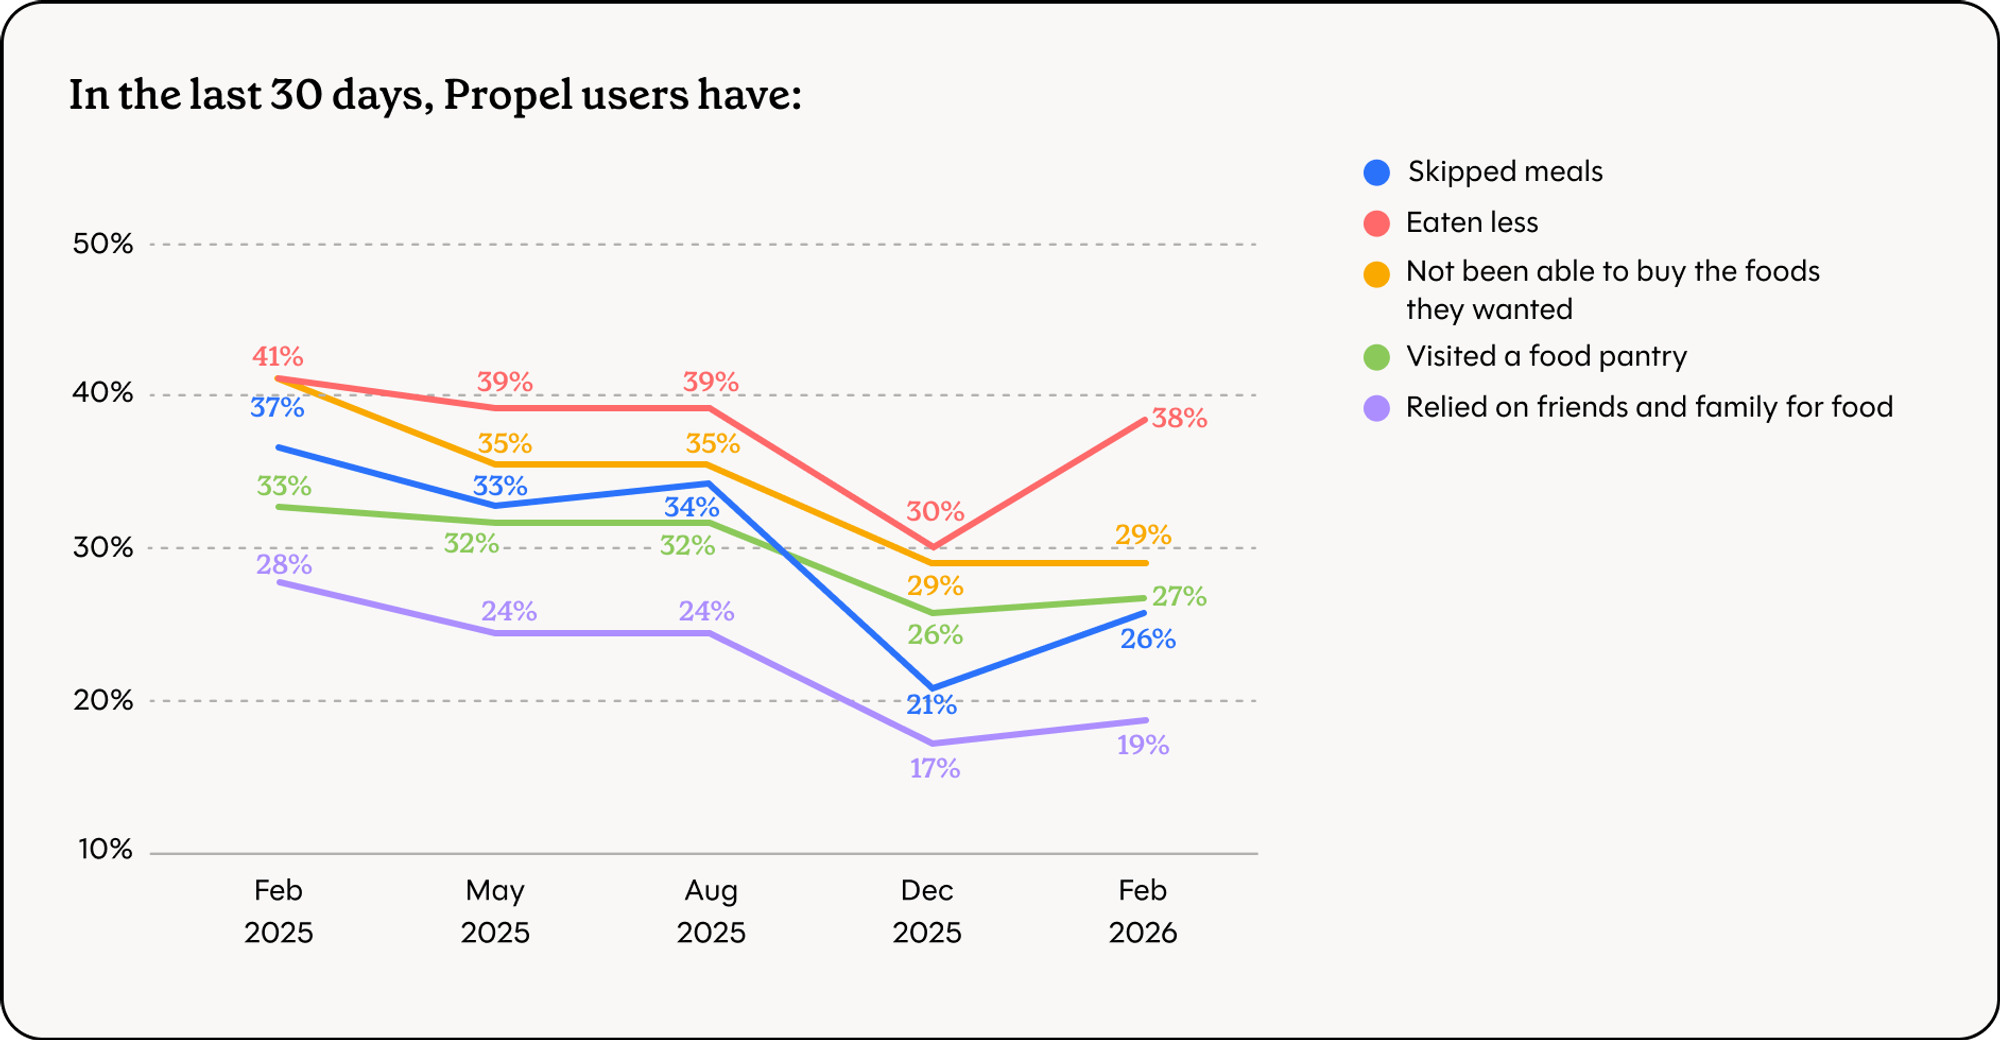
Overall, food insecurity indicators remain elevated but show a mixed trend compared to recent months. Worry about food running out has declined substantially since last summer, and fewer households report visiting food pantries or relying on friends and family compared to a year ago. However, short-term measures of hardship, including eating less and skipping meals, have ticked up since December, suggesting that while conditions have improved compared to early 2025, many households continue to face persistent and uneven financial strain.
- 41% of respondents said they are worried that their food will run out before they can buy more, a slight decrease from December and down 25% from August 2025.
- 38% reported eating less in the last 30 days, up 24% from December but about the same percentage as survey respondents in the first three quarters of 2025.
- 29% were not able to buy the kinds of food they wanted, the same percentage as December and down 34% from last February.
- 27% visited a food pantry in the last 30 days, a slight uptick from December but down 20% from last February.
- 26% reported skipping meals, up 21% from December but down 35% from last February.
- 19% relied on family and friends for groceries, a slight uptick from December but down 38% from last February.
Financial insecurity#financial-insecurity
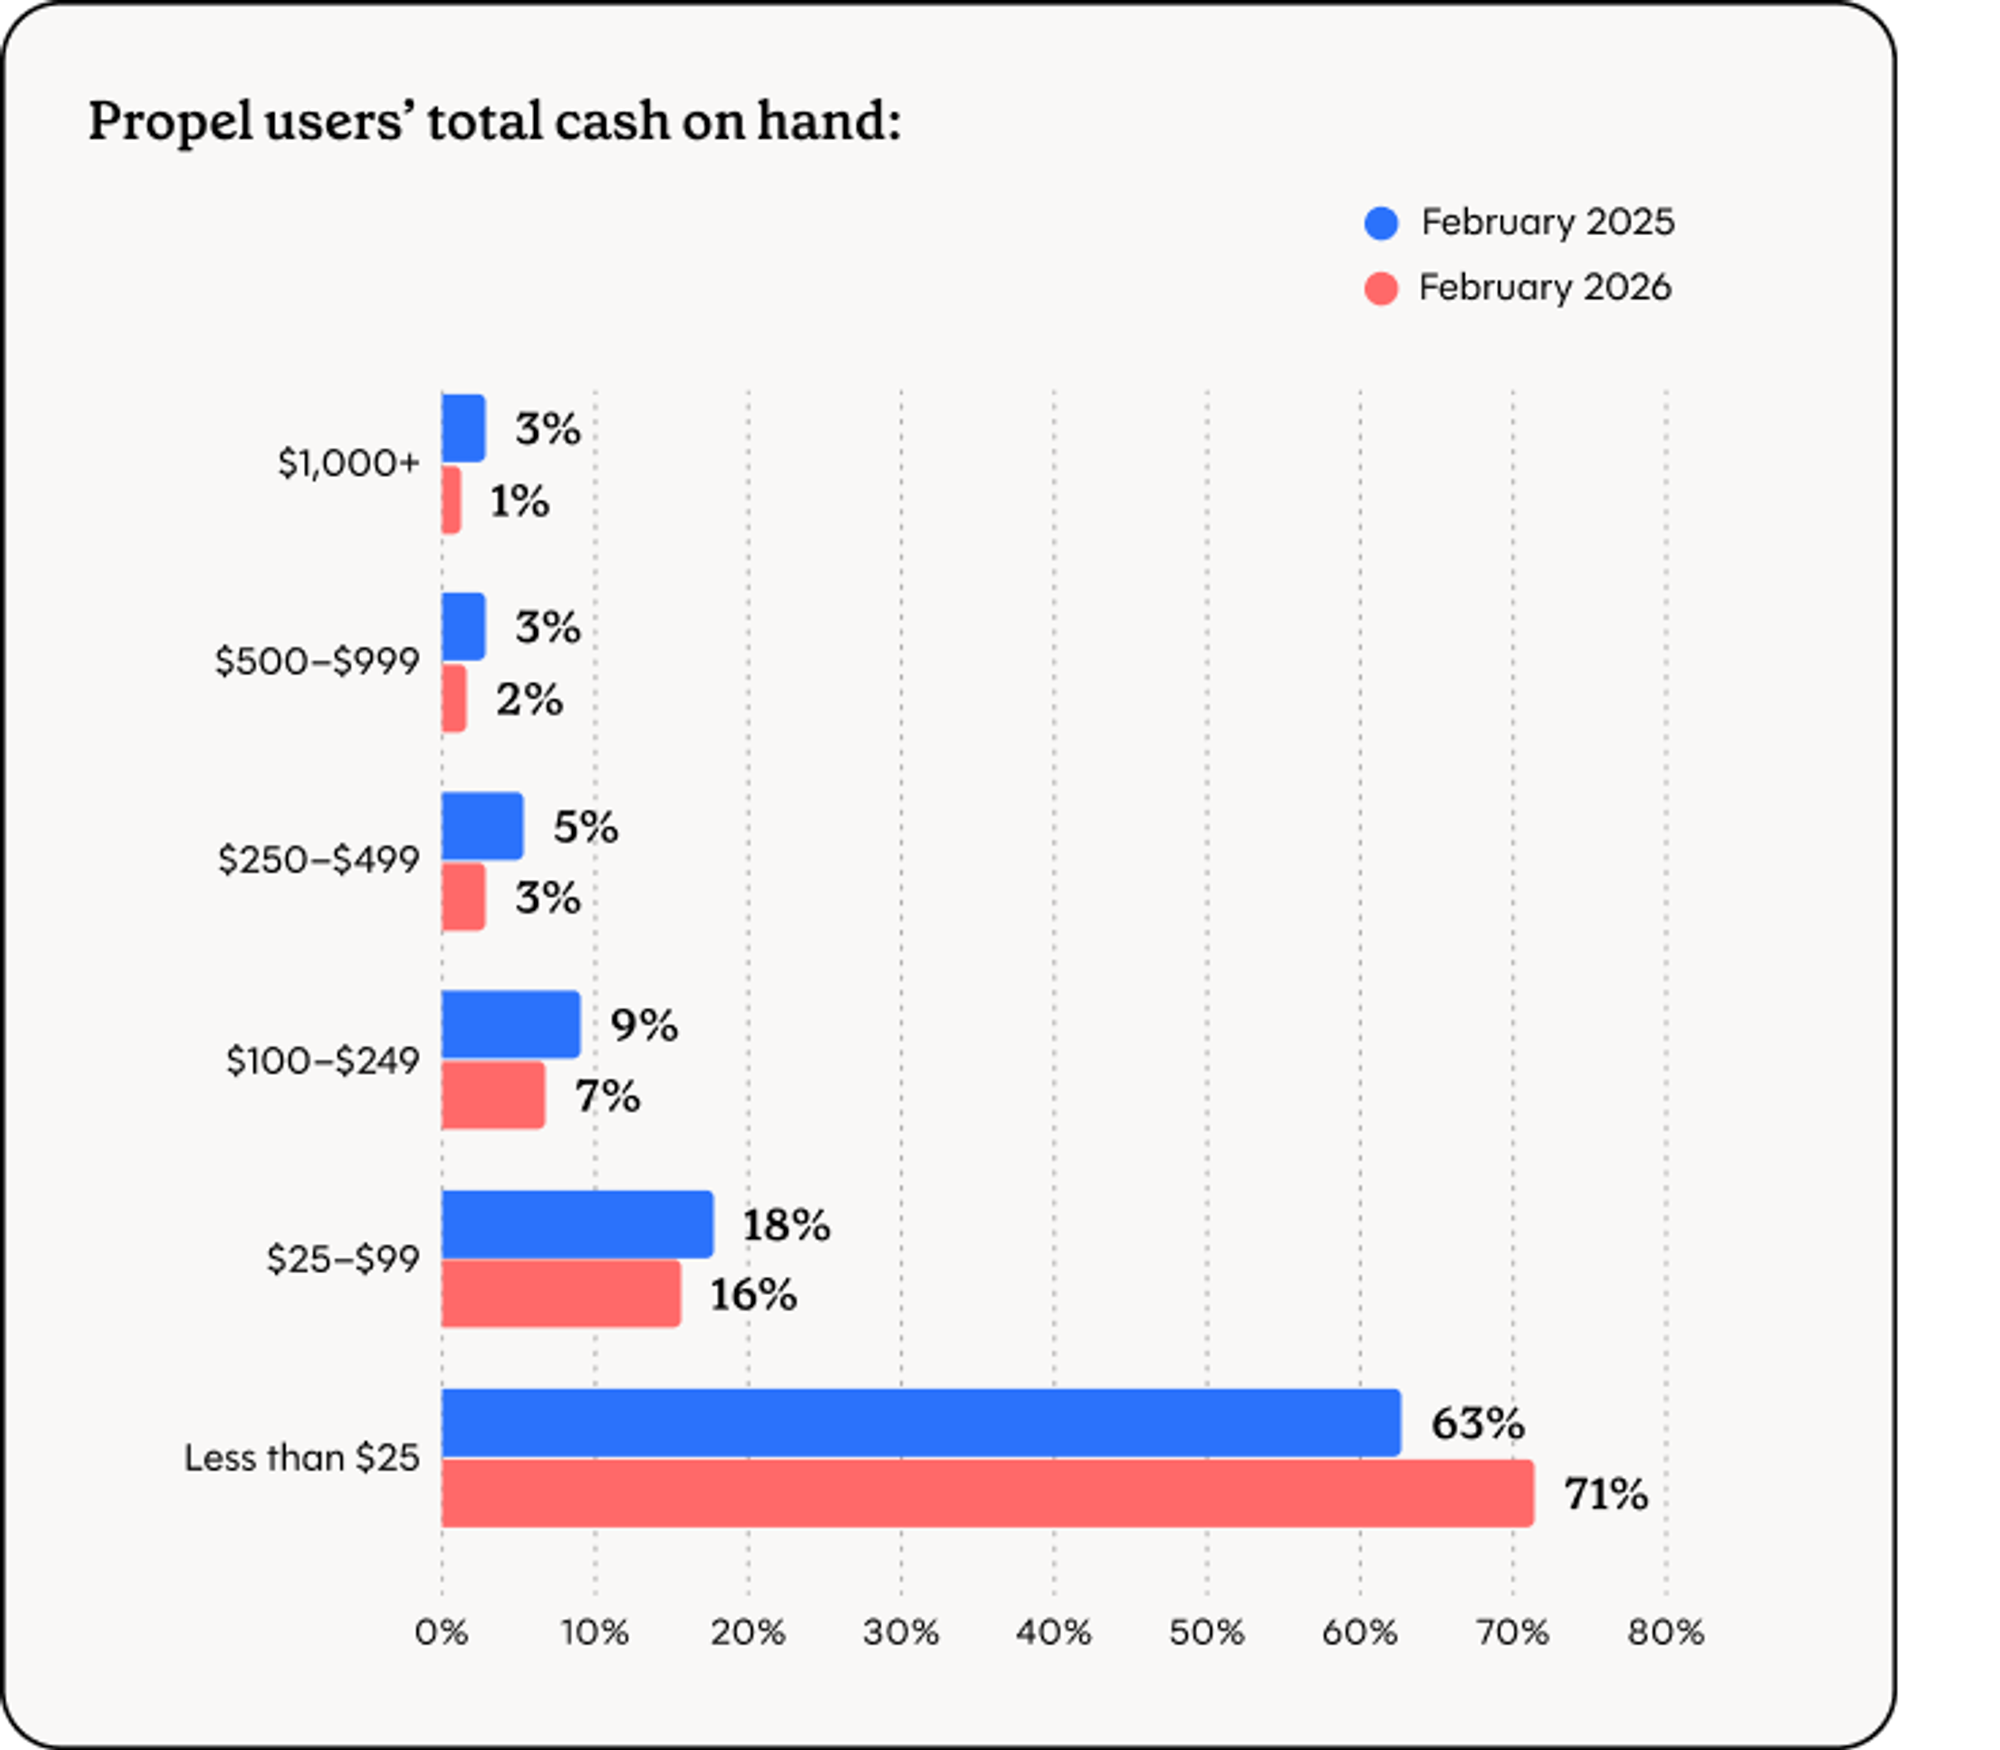
Financial stability indicators point to mounting liquidity pressure, even as some household conditions show improvement. A record 71% of respondents report having less than $25 in cash on hand (the highest level observed) while late utility payments have edged up slightly since December. At the same time, fewer households say they lack basic necessities or paid rent late compared to December, though housing instability persists, with 1 in 10 respondents reporting they moved in with others because they could no longer afford their housing costs.
- 71% of respondents have less than $25 in cash on hand, an 18% increase from December and the highest percentage recorded since the survey began.
- 46% say that they do not have everything they typically need in their home right now, a 25% decrease from December 2025 and the lowest percentage recorded since the survey began.
- 36% paid their utility bill late in the past 30 days, slightly higher than December but low relative to May and August.
- 27% paid their rent or mortgage late, a 14% decrease from December but virtually unchanged from a year ago.
- 10% moved in with others because they could no longer afford their rent or mortgage, up slightly from December.
Borrowing & debt#borrowing-and-debt
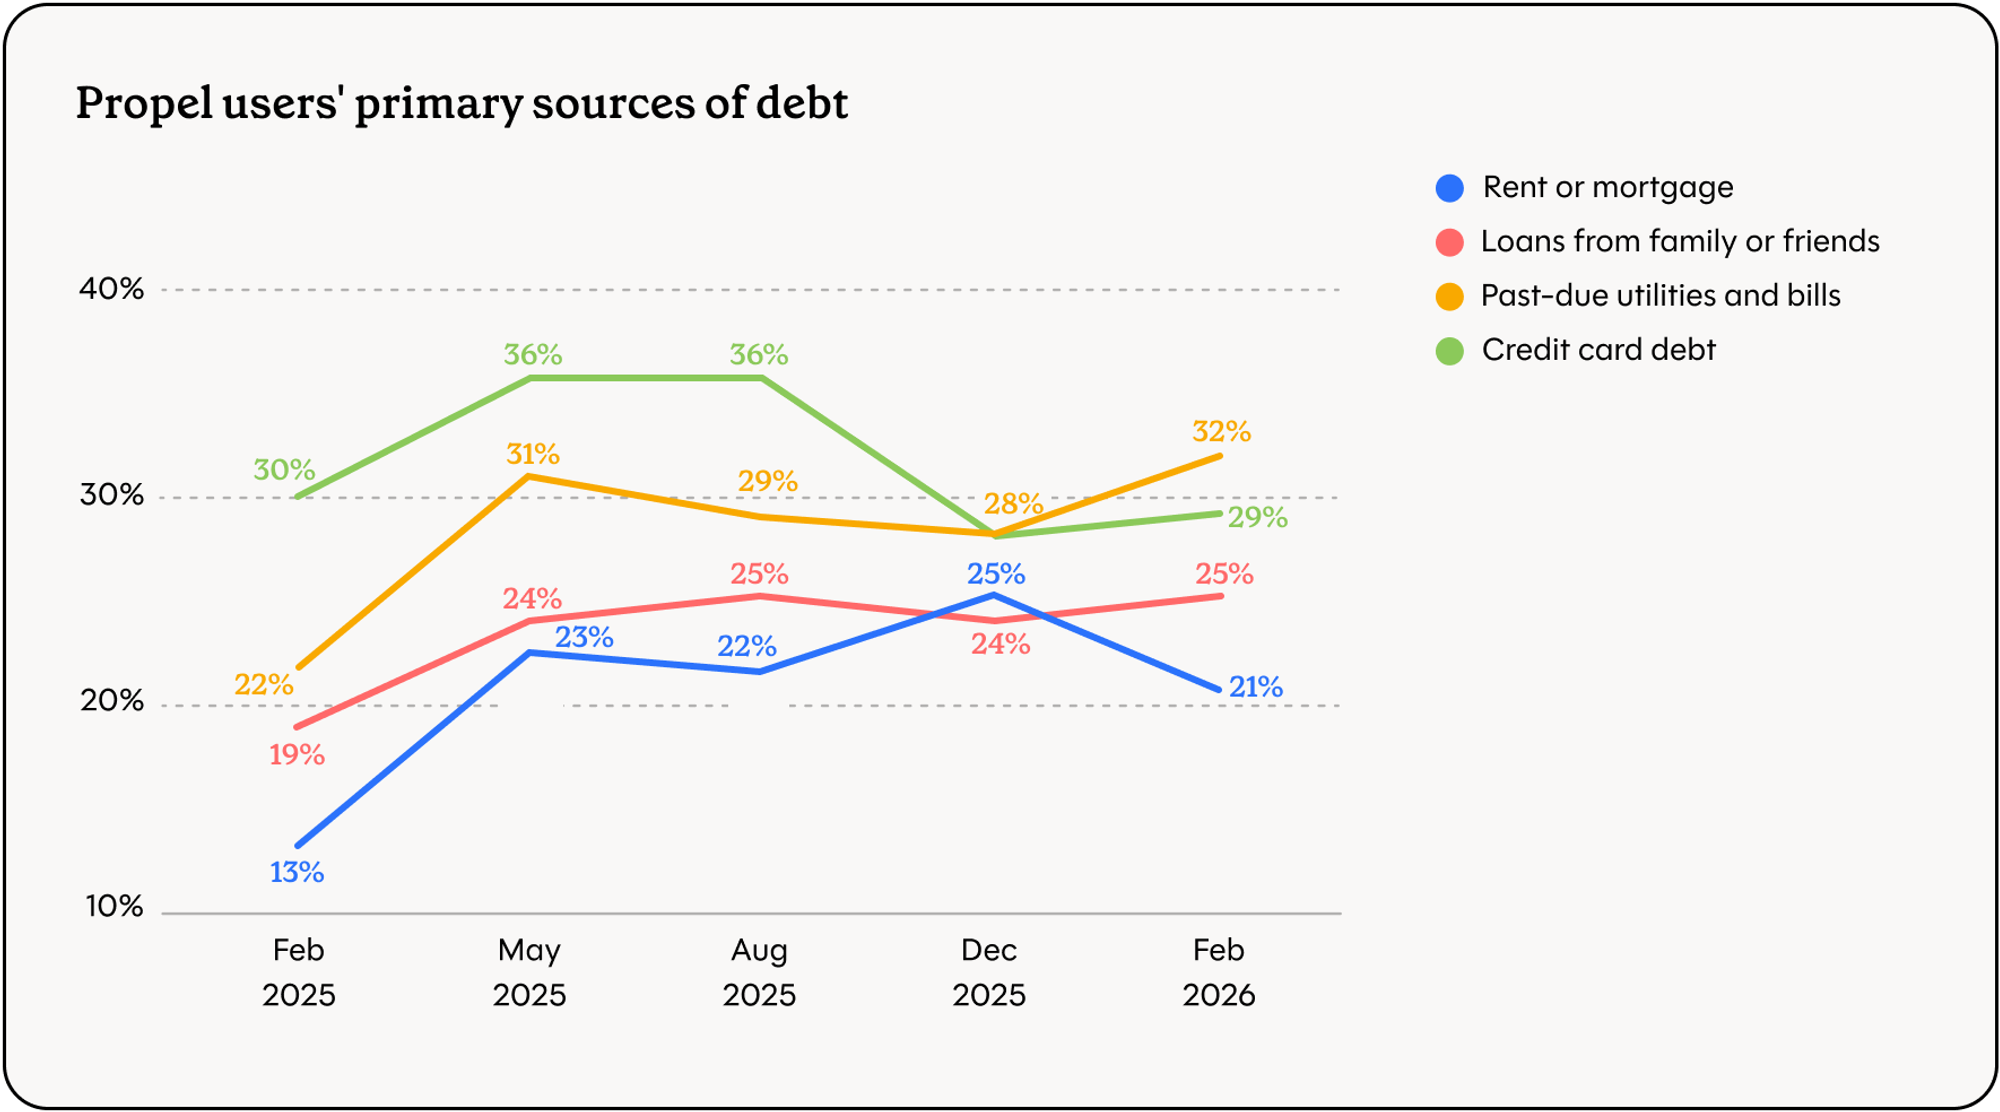
Borrowing and debt levels are trending upward, particularly in short-term and alternative credit products. Use of “buy now, pay later” services increased sharply since December, and 12% of respondents now report carrying debt from those services, while payday and pawnshop borrowing also ticked up. Meanwhile, nearly one-third of households have past-due utility or other bill debt – a significant increase over both December and last February – and credit card debt remains widespread and steady year over year.
- 11% took out a payday or pawnshop loan in the last 30 days, a slight uptick from December.
- 14% used a “buy now, pay later” service, up 33% from December. And 12% report having debt from those same “buy now, pay later” services.
- 32% have debt from past-due utilities and other bills, up 13% from December and up 37% from last February.
- 29% report having credit card debt, a slight uptick from December but virtually unchanged since last February.
Work requirements#work-requirements
While roughly one quarter of surveyed SNAP participants report receiving new work requirement notices from their state, nearly half of those individuals also report losing or being at risk of losing benefits. However, only a minority of respondents directly attribute changes to work requirements, suggesting confusion about the source of disruptions and highlighting the complexity of overlapping policy shifts.
- 26% of all respondents (1,387) said they had received a notice from their state in the past six months that they must work or volunteer to keep their SNAP benefits.
- 39% of all respondents experienced a negative change in their SNAP benefits (benefits stopped, reduced, or told they will stop) in the past six months.
- 48% of those who received a notice reported a negative change in the past six months, compared to 40% of those who did not receive a notice.
- 16% of those who received a notice attributed their benefit changes specifically to work requirements. 14% attributed them to a self-reported change (job, income, household) and 10% said they weren’t sure.