


Data insights: July 2026 EBT theft trends
Our editorial promise
All of our Propel editorial content meets our high bar for accuracy, timeliness, trust, and relevance. Our pages are edited and fact-checked to make sure we meet our mission of giving you information you can rely on.
Learn more about our editorial standards.
Return to Propel’s EBT Theft Hub
Key findings#key-findings
- Overall EBT theft held steady in June, with the highest theft rates now concentrated in mid-Atlantic states from Delaware to Virginia and Connecticut.
- Delaware led the nation for a second straight month (0.48% theft rate) with Virginia (0.39%) and Connecticut (0.38%) moving into second and third place.
- Virginia's skimming network spread from Richmond into Hampton Roads; Connecticut saw a concentrated cluster of skimming activity in the Stamford area; and Maryland saw elevated theft around Baltimore and the Eastern Shore.
- Pennsylvania's theft rate was roughly flat from May (0.27%) to June (0.26%), but its absolute scale dwarfs states with higher rates. Almost 6,000 Pennsylvania users were liquidated in June and early July — more than Delaware, Virginia, and Connecticut combined.
Propel’s theft detection capabilities#propels-theft-detection-capabilities
Propel serves over 5 million EBT cardholders nationwide who use our app to manage their benefits every month. We analyze transaction and customer-reported data to identify emerging theft patterns through a two-step detection process. First, we identify retailers with unusually high rates of transactions flagged as “unrecognized” by Propel users. These are retailers where stolen benefits appear to be drained or liquidated. Second, we identify skimmer locations by analyzing victims’ shopping patterns in the 8-12 weeks prior to their card being liquidated.
Our insights are intended to provide a snapshot of emerging trends in EBT theft. We generate these analyses early in the month, when theft activity typically peaks following SNAP benefit deposits. Our data reflects real theft activity, but may show a slight upward bias since cardholders are more likely to check the app after experiencing theft. Given the rapidly evolving nature of EBT theft, our insights represent a current snapshot rather than a comprehensive assessment.
Recent theft patterns and spikes#recent-theft-patterns-and-spikes
Overall theft held steady in July, remaining at a similar level as June’s elevated theft rate. Mid-Atlantic states now have the highest theft rates in the country, and liquidation is elevated from Fairfield County, Connecticut, to Hampton Roads, Virginia.
Delaware led the country for a second straight month with high theft rates in central and northern Delaware. Philadelphia has a dual role in the theft system: users in the area are liquidated, and retailers purporting to be in the area liquidate users across many states. Virginia's theft continued to climb, spreading from Richmond into Hampton Roads. Connecticut's early-June spike seems centered around Stamford-area skimming.
| Rank | April 2026 | May 2026 | June 2026 |
|---|---|---|---|
| 1 | AR (0.47%) | DE (0.48%) | DE (0.48%) |
| 2 | IN (0.37%) | NJ (0.37%) | VA (0.39%) |
| 3 | NJ (0.33%) | VA (0.28%) | CT (0.38%) |
| 4 | SC (0.25%) | PA (0.27%) | PA (0.26%) |
| 5 | PA (0.24%) | AR (0.26%) | MD (0.26%) |
| 6 | NY (0.23%) | IN (0.25%) | NJ (0.22%) |
| 7 | DE (0.22%) | MD (0.23%) | NY (0.22%) |
| 8 | AL (0.22%) | NY (0.22%) | IN (0.21%) |
Fraction of transactions marked as unrecognized, by county (June 1–July 8, 2026)
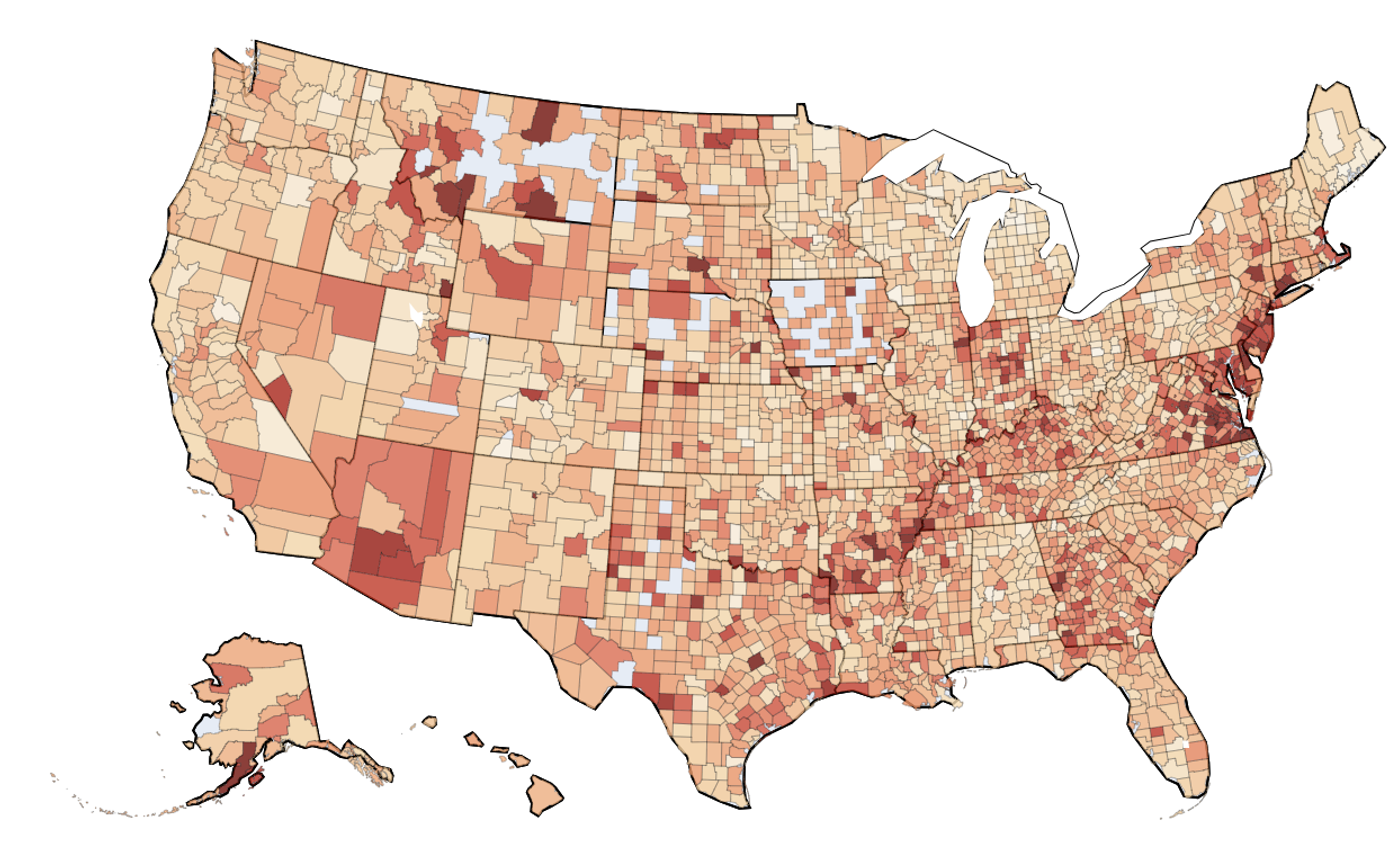
Users from different states often share liquidation locations. This could mean one operation is compromising cards across states and liquidating them en masse, but it more likely indicates that different actors are compromising cards and selling information to criminals who perform liquidation.
Fraction of unrecognized transactions nationwide
Delaware leads again with northern and central users compromised#delaware-leads-again-with-northern-and-central-users-compromised
Delaware had the highest theft rate for the second consecutive month, holding at its May level. Theft remains concentrated in Kent and New Castle counties — 4.6% of Kent users and 4.2% of New Castle users marked a transaction unrecognized — while Sussex County in the south remains near normal levels.
Unrecognized transaction rate by county in Delaware (June 1–July 8, 2026)
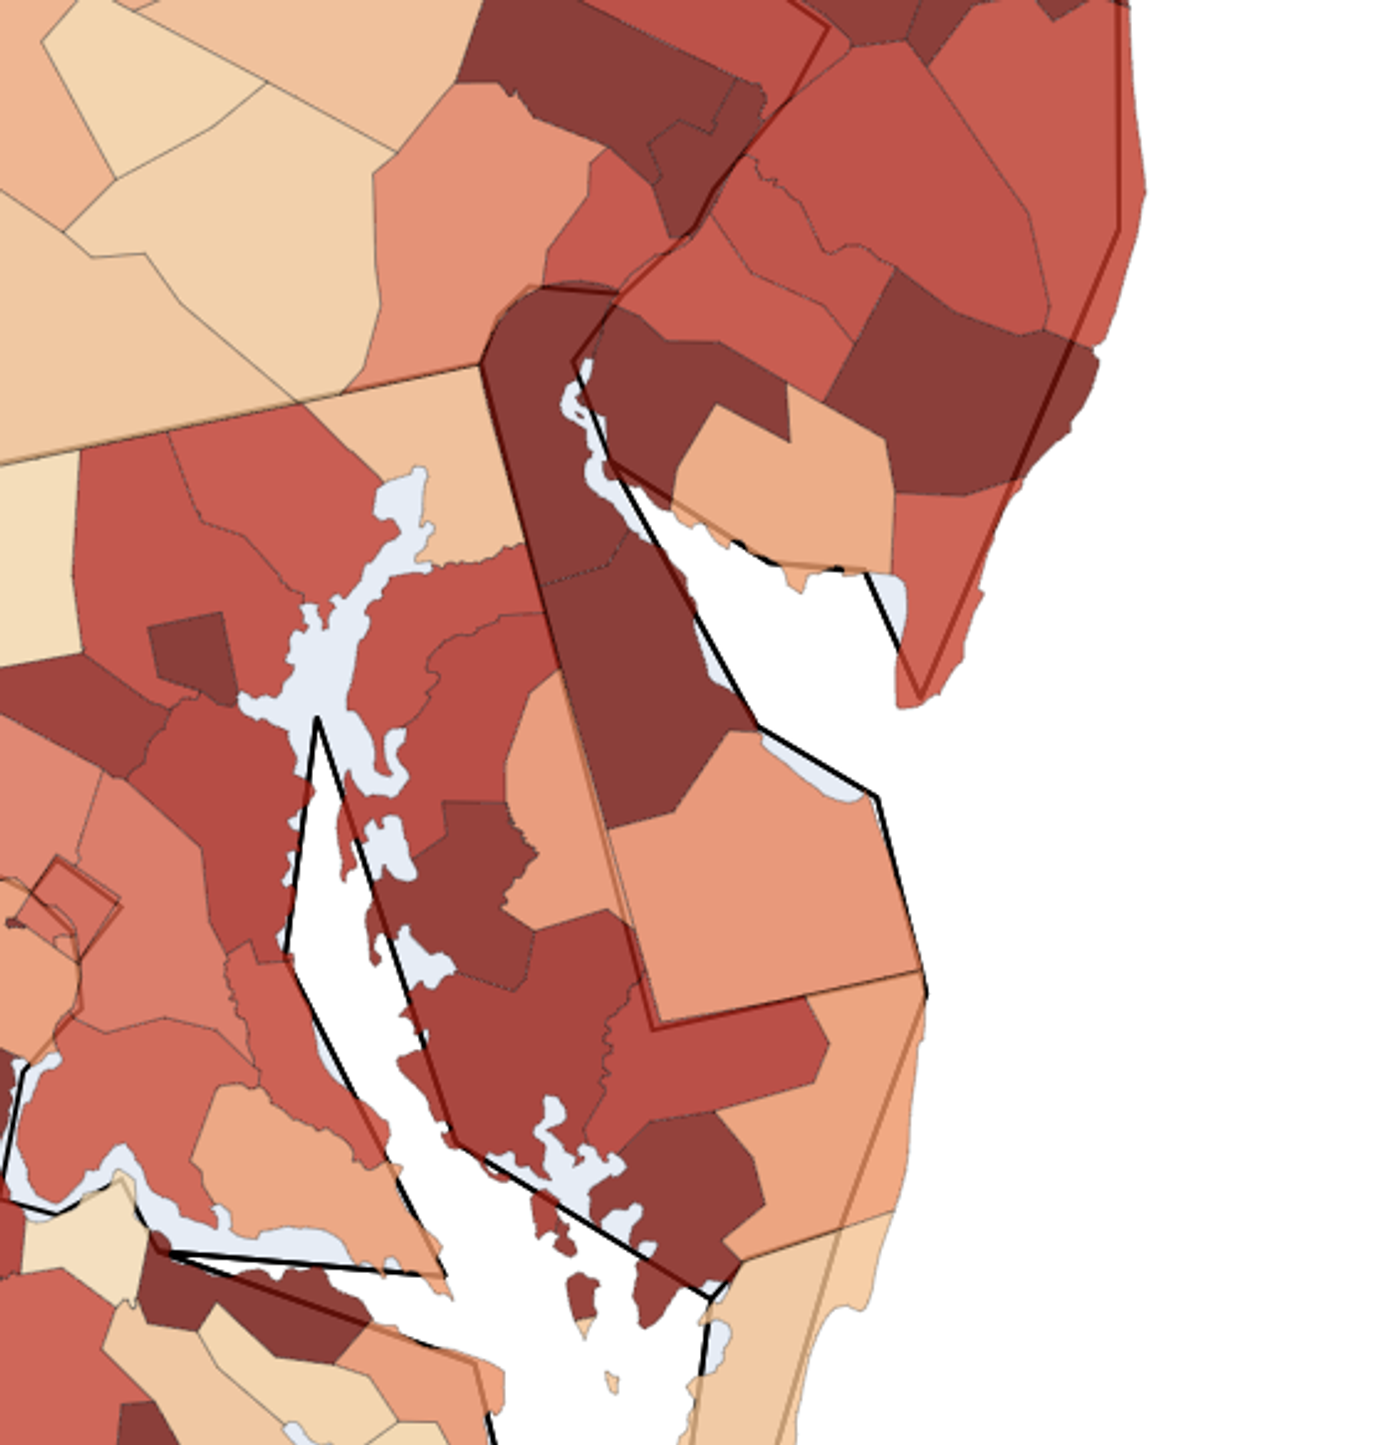
As with last month, liquidation in Delaware is happening almost entirely out of state, dominated by Philadelphia and New Jersey corner stores — the same liquidators that appear for Virginia and Connecticut victims.
Pennsylvania theft is concentrated in Philadelphia#pennsylvania-theft-is-concentrated-in-philadelphia
Pennsylvania's theft rate was roughly flat from May (0.27%) to June (0.26%), but its absolute scale dwarfs states with higher rates: almost 6k Pennsylvania users were liquidated in June and early July — more than Delaware, Virginia, and Connecticut combined.
Unrecognized transaction rate by county in Pennsylvania (June 1–July 8, 2026)
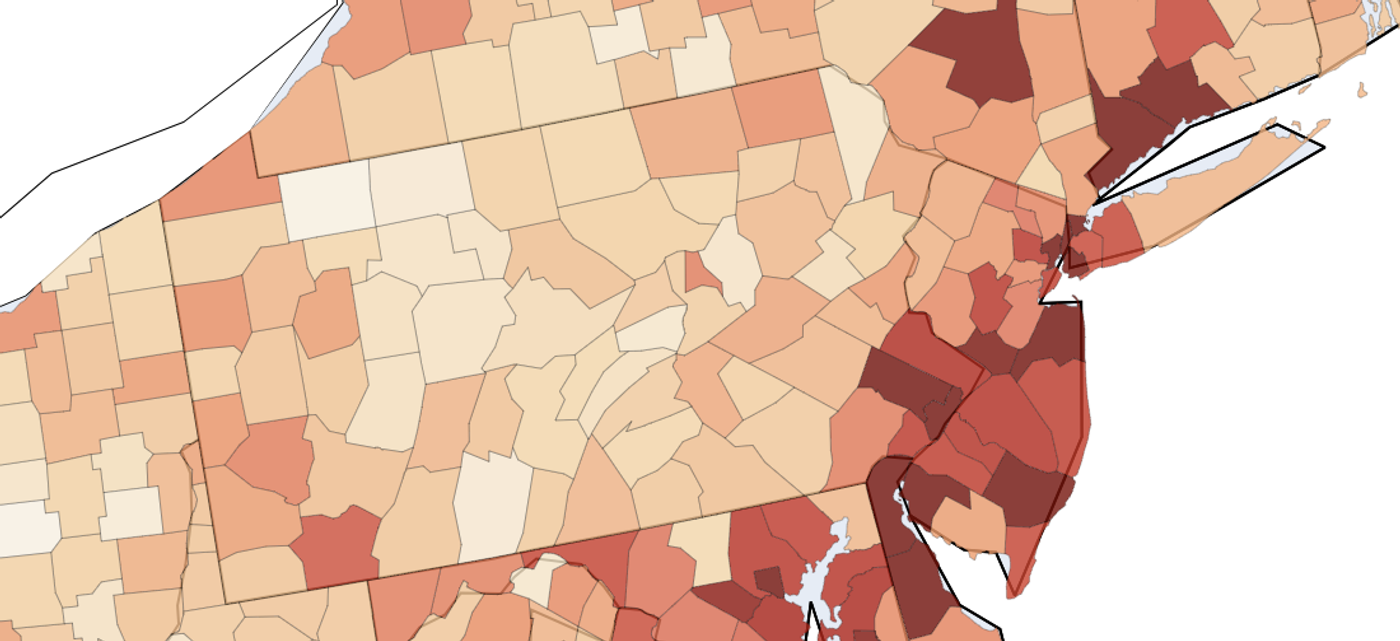
As mentioned last month, identifying skimmers in Pennsylvania is difficult because of the dual role Philadelphia plays in the regional theft network. Retailers purporting to be in the Philadelphia area liquidate users in Pennsylvania (as well as Delaware, Connecticut, and Virginia). We identify likely skimmers based on their shopper overlap with liquidators. Since liquidation often happens across multiple retailers, it's hard to separate a transaction that was part of a liquidation spree from a skim — both types of locations have high user overlap with future liquidators.
Virginia skimming spreads from Richmond into Hampton Roads#virginia-skimming-spreads-from-richmond-into-hampton-roads
Virginia's theft rate rose for the second month, from 0.28% in May to 0.39% in June. Sharp theft spikes on deposit days at the start of each month have grown larger month over month, but may have hit their peak in June.
Fraction of unrecognized transactions in Virginia vs. other states
The greater Richmond area remains the epicenter — Petersburg (8.7% of users), Hopewell (8.0%), Henrico (8.0%), Richmond (7.7%), and Chesterfield (6.6%) have the state's highest victim rates — but Hampton Roads in the southeast is now clearly elevated as well. Newport News has the highest unrecognized tap rate in southeastern Virginia at 5.7%.
Unrecognized transaction rate by county in Virginia (June 1–July 8, 2026)
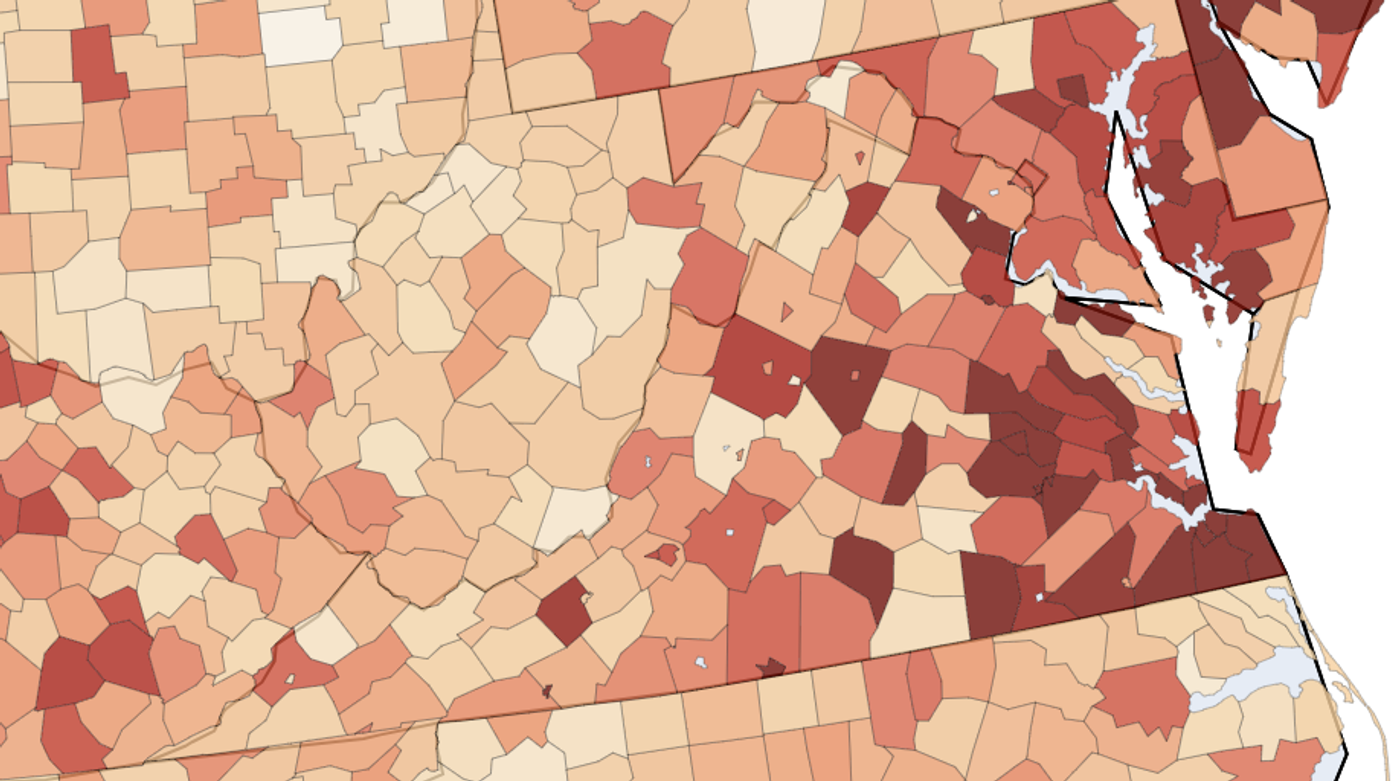
Of the 1.3k Virginia users liquidated in June and early July, 70% of them had shopped at a location later identified as a likely skimmer. A specific retail chain accounts for a meaningful share of the pattern: 16% of all Virginia victims shopped at one of a small number of stores identified as likely skimming locations. As in prior months, liquidation of benefits held by Virginia cardholders is primarily happening out of state at Philadelphia, New Jersey, and New York City retailers.
Connecticut's spike is related to Stamford-area skimming#connecticuts-spike-is-related-to-stamford-area-skimming
Last month's report flagged a sharp early-June theft spike in Fairfield County. This month, elevated theft rates have spread to neighboring New Haven. 5% of Fairfield County users and 3% of New Haven users marked a June or early July transaction unrecognized. Early July shows a spike as well, but nowhere near the level of June.
Fraction of unrecognized transactions in Connecticut vs. other states
Unrecognized transaction rate by county in Connecticut (June 1–July 8, 2026)
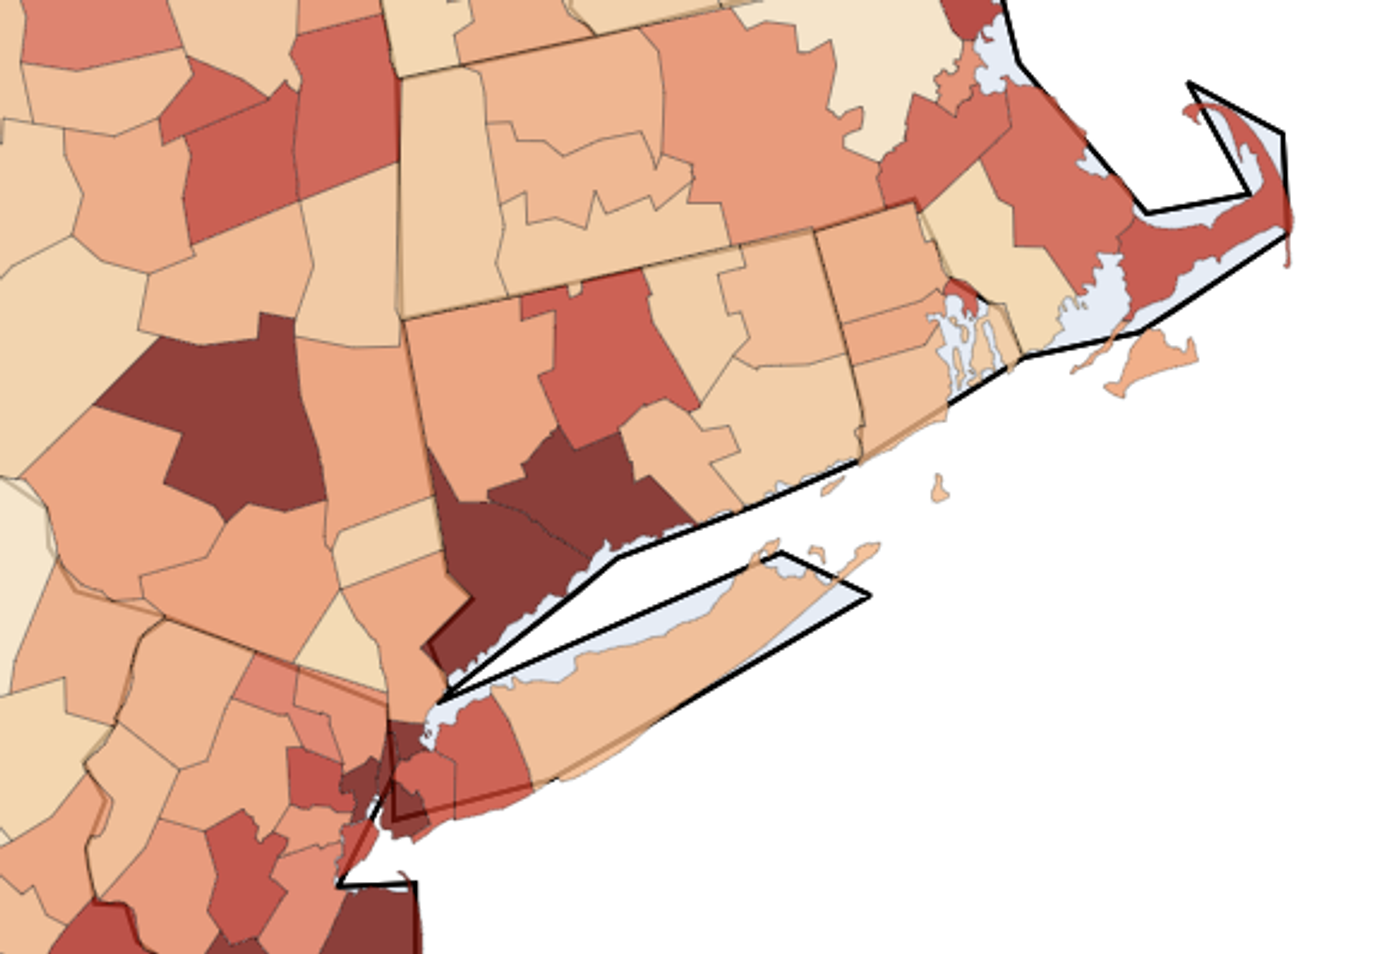
21 likely skimmers were identified, and 70% of Connecticut's 770 liquidated users shopped at one. Skimming activity is concentrated along a single corridor in Stamford, with additional locations elsewhere in Fairfield County. As with Delaware and Virginia, liquidation of benefits held by Connecticut cardholders happens almost entirely out of state at Philadelphia and New Jersey stores. No Connecticut retailer appears among the top liquidators.
Maryland theft#maryland-theft
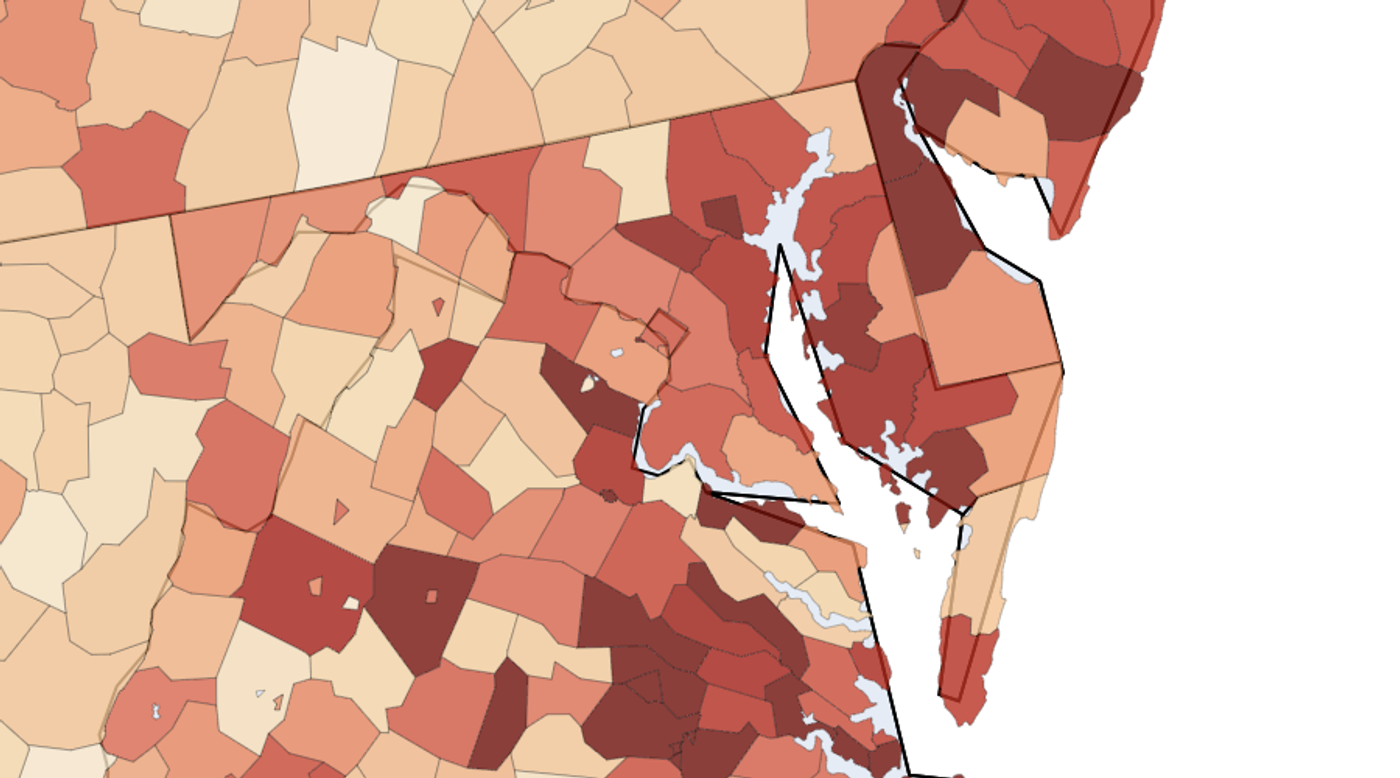
Maryland's theft rate is highest among users around Baltimore, but the Eastern Shore also saw elevated theft in June. This concentration points to skimmers as a potential compromise mechanism. However, Maryland's transaction data does not include retailer identity, so store-level skimmer analysis is not possible.
Unrecognized transaction rate by county in Maryland (June 1–July 8, 2026)
Ongoing support#ongoing-support
Propel is committed to supporting state and federal agencies in protecting SNAP recipients from EBT theft. For questions about our methodology or further analysis, please contact gov@propel.app.