


Data insights: June 2026 EBT theft trends
Our editorial promise
All of our Propel editorial content meets our high bar for accuracy, timeliness, trust, and relevance. Our pages are edited and fact-checked to make sure we meet our mission of giving you information you can rely on.
Learn more about our editorial standards.
Return to Propel’s EBT Theft Hub
Key findings#key-findings
- Theft declined nationally from April to May but remained elevated compared to late 2025 and early 2026; Delaware led all states in May with a 0.57% theft rate, followed by New Jersey (0.38%) and Virginia (0.34%).
- Theft patterns are shifting to heavily favor in-state transactions. According to our analysis, 70% of theft in April 2026 occurred in-state. This amount represents a new peak of a months-long trend, and is driven in part by high levels of in-state theft in the mid-Atlantic.
- Virginia saw a 50% month-over-month theft rate increase in May, driven by skimmers concentrated in the greater Richmond area. Liquidation was primarily at retailers purporting to be in Pennsylvania, New Jersey, and New York–this trend has continued into early June. Connecticut also saw a sharp theft spike in early June, highly localized to Fairfield County, with liquidation at the same purported Philadelphia- and New York-area retailers used to steal Virginia benefits.
- Arkansas Summer EBT cardholders were specifically targeted in May despite declining overall theft in the state; Summer EBT-only cards saw substantially higher theft rates than regular SNAP cards, a more extreme version of a pattern also seen in 2025.
Propel’s theft detection capabilities#propels-theft-detection-capabilities
Propel serves over 5 million EBT cardholders nationwide who use our app to manage their benefits every month. We analyze transaction and customer-reported data to identify emerging theft patterns through a two-step detection process. First, we identify retailers with unusually high rates of transactions flagged as “unrecognized” by Propel users. These are retailers where stolen benefits appear to be drained or liquidated. Second, we identify skimmer locations by analyzing victims’ shopping patterns in the 8–12 weeks prior to their card being liquidated.
Our insights are intended to provide a snapshot of emerging trends in EBT theft. We generate these analyses early in the month, when theft activity typically peaks following SNAP benefit deposits. Our data reflects real theft activity, but may show a slight upward bias since cardholders are more likely to check the app after experiencing theft. Given the rapidly evolving nature of EBT theft, our insights represent a current snapshot rather than a comprehensive assessment.
Recent theft patterns and spikes#recent-theft-patterns-and-spikes
Theft declined from April to May, though remained higher than late 2025 and early 2026. New Jersey and Pennsylvania saw month-over-month increases in theft rates. Along with New York, these states account for much of the overall move toward in-state theft. Neighboring Delaware had the highest theft rate in May.
| Rank | March 2026 | April 2026 | May 2026 |
|---|---|---|---|
| 1 | NJ (0.38%) | AR (0.49%) | DE (0.57%) |
| 2 | AR (0.34%) | IN (0.38%) | NJ (0.38%) |
| 3 | SC (0.28%) | NJ (0.33%) | VA (0.34%) |
| 4 | DE (0.26%) | SC (0.25%) | PA (0.27%) |
| 5 | MD (0.19%) | DE (0.25%) | AR (0.25%) |
| 6 | NY (0.19%) | PA (0.24%) | IN (0.24%) |
| 7 | CT (0.18%) | NY (0.23%) | MD (0.24%) |
| 8 | KY (0.17%) | AL (0.22%) | NY (0.23%) |
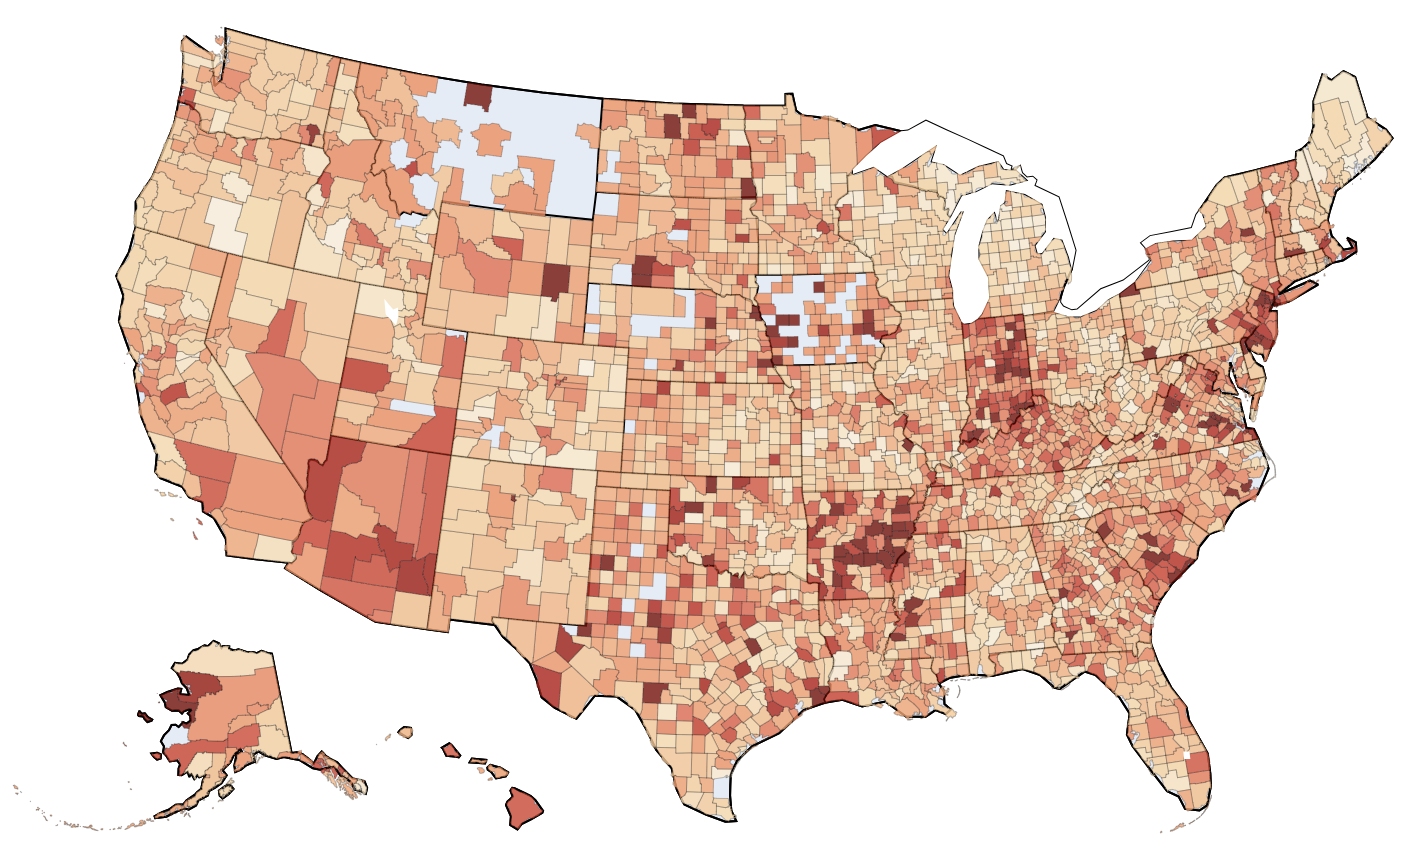
EBT theft rates by county, May–June 2026
About this data
Fraction of transactions marked as unrecognized, for each county. Based on transactions from May 1–June 7, 2026.
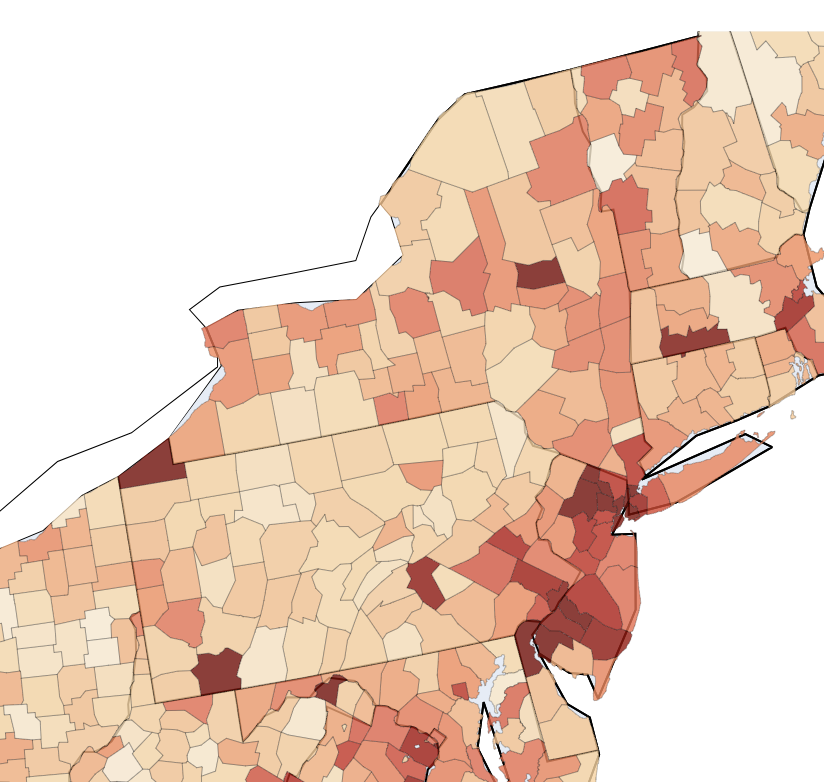
80% of fraudulent transactions came from cardholders in New York (44%), Pennsylvania (27%), and New Jersey (9%). This is partly due to large state populations, but these neighboring states and Delaware also had some of the highest theft rates in May. Defrauded users are concentrated in the New York City and Philadelphia areas, pointing to skimming as a likely cause. However, identifying specific skimmers is difficult since liquidation often happens in these same areas; these locations then have overlapping victims. It is challenging to differentiate a skimmer (where a card was compromised) from a string of liquidation locations because of this high user overlap.
Unrecognized transaction rate by county: Delaware, New Jersey, New York, and Pennsylvania
About this data
Unrecognized transaction rate by county in Delaware, New Jersey, New York, and Pennsylvania from May 1–June 7, 2026.
Fraction of fraudulent transactions that occurred in-state
About this data
Share of fraudulent transactions at retailers in the cardholder's home state, by month from August 2024–May 2026. Fraud is identified by user-reported unrecognized transactions. Figures for the most recent weeks may be revised upward as more theft is reported.
Historically, retailers purporting to be in New York, Pennsylvania, and New Jersey have accounted for a large portion of fraudulent transactions. As users in these states become victims, the overall portion of in-state theft rises. Out-of-state transaction blocking is a lower-maintenance security measure for most users than card locking, where settings frequently have to be changed. Unfortunately, out-of-state transaction blocking is a decreasingly effective theft prevention metric.
The chart below breaks down fraudulent transactions by cardholder state (x-axis) and retailer state (color). In-state theft dominates New York, accounts for more than half of theft in Pennsylvania, and roughly a quarter in New Jersey. Delaware cardholders are largely defrauded at Pennsylvania and New Jersey retailers — very little theft occurs at retailers with Delaware locations, even among Delaware cardholders.
Percentage of fraudulent transactions by suspicious retailer and cardholder state
About this data
Share of fraudulent transactions by the state of the suspicious retailer where the transaction posted, grouped by the cardholder's home state, May 1–June 7, 2026. The cardholder's home state is shown with diagonal striping; counts above each bar show total flagged transactions.
Virginia theft rate increases through May and June#virginia-theft-rate-increases-through-may-and-june
Virginia climbed back into the top three theft states with a 50% increase from 0.23% in April to 0.34% in May. This increase appears to be continuing into June.
Fraction of unrecognized transactions in Virginia vs. other states
About this data
Weekly fraction of transactions marked as unrecognized by cardholders in Virginia vs. all other states combined, February–June 2026. Data excludes the most recent 7 days due to transaction processing lag.
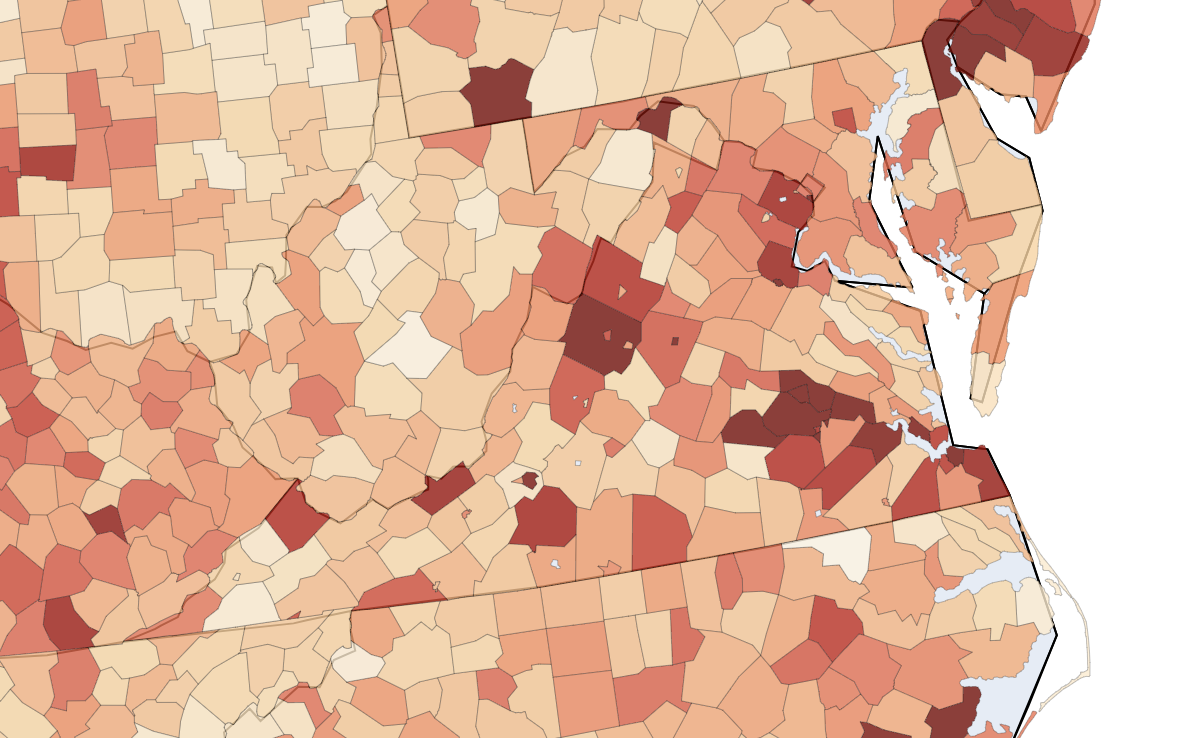
946 users were liquidated in May and early June, 63% of which shopped at skimmers largely concentrated in the greater Richmond area. As in prior months, much of the liquidation itself took place at retailers purporting to be in Pennsylvania, New Jersey, and New York. So far in June, the Richmond localization has been consistent with May.
Unrecognized transaction rate by county in Virginia
About this data
Unrecognized transaction rate by county in Virginia from May 1–June 7, 2026.
Fairfield County driving Connecticut’s early June theft spike#fairfield-county-driving-connecticuts-early-june-theft-spike
Connecticut has seen a sharp increase in theft in June. Benefits have largely been stolen at stores in Philadelphia and New York — often the same liquidators used to steal Virginia benefits. Connecticut deposits arrive the first eight days of the month; so far, liquidation has been elevated on each deposit day.
Fraction of unrecognized transactions in Connecticut vs. other states
About this data
Weekly fraction of transactions marked as unrecognized by cardholders in Connecticut vs. all other states combined, February–June 2026. The final week is preliminary and may change as more June data posts. Data excludes the most recent days due to transaction processing lag.
Daily fraction of unrecognized transactions in Connecticut
About this data
Daily fraction of transactions marked as unrecognized by Connecticut cardholders, February–June 2026.
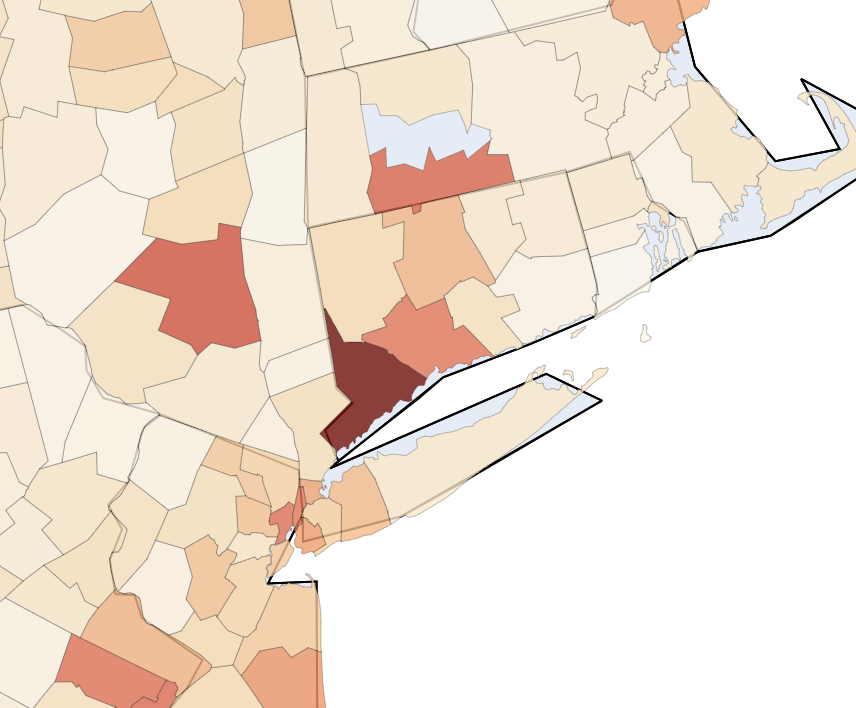
Theft is tightly localized to Fairfield County. Unrecognized transaction rates are extremely elevated in Fairfield with slight elevation spilling over into bordering New Haven County.
Unrecognized transaction rate by county in Connecticut
About this data
Unrecognized transaction rate by county in Connecticut from June 1–June 7, 2026.
Non-Summer EBT theft receding in Arkansas while Summer EBT theft explodes#non-summer-ebt-theft-receding-in-arkansas-while-summer-ebt-theft-explodes
Arkansas, which led April theft at 0.49%, saw an almost 50% decrease in May. However, May has seen Summer EBT cards in particular targeted, a known issue in Arkansas. The overall decrease occurred despite the sharp Summer EBT increase because Summer EBT makes up a relatively small portion of Arkansas SNAP benefits. In 2025, Summer EBT-only cards saw higher theft rates than cards not exclusively used for Summer EBT, but the difference between the two is much higher this year.
Fraction of unrecognized transactions in Arkansas amongst SNAP and Summer EBT cardholders
About this data
Unrecognized transaction rate, broken down by Summer EBT and SNAP participation: cardholders with only Summer EBT, only SNAP (no Summer EBT), or both. January 2025–May 2026.
Ongoing support#ongoing-support
Propel is committed to supporting state and federal agencies in protecting SNAP recipients from EBT theft. For questions about our methodology or further analysis, please contact gov@propel.app.