June 2026 Pulse Survey
Our editorial promise
All of our Propel editorial content meets our high bar for accuracy, timeliness, trust, and relevance. Our pages are edited and fact-checked to make sure we meet our mission of giving you information you can rely on.
Learn more about our editorial standards.
Summary
Multiple measures of food insecurity and financial instability were higher this quarter as compared to earlier in the year. Since December 2025, eating less, shelter use, and skipped medication have all risen. Debt tied to covering immediate costs (bank loans, payday and pawn shop loans, and buy now, pay later) also increased year-over-year, even as several other debt categories held flat or declined.
The following insights come from a <10-minute multiple choice and open response survey conducted by Propel. For Q2, responses came from 11,642 randomly selected households out of more than 5 million Propel users from June 5–11, 2026. All respondents are EBT cardholders.
Figures below cover two timeframes: year-over-year (Q2 2025 vs. Q2 2026) and since December 2025. In some cases, the year-over-year view appears to be improving, driven by improvement in mid-2025 while the year-to-date view shows insecurity rising. These timeframes don't always point the same way.
Food Choices#food-choices
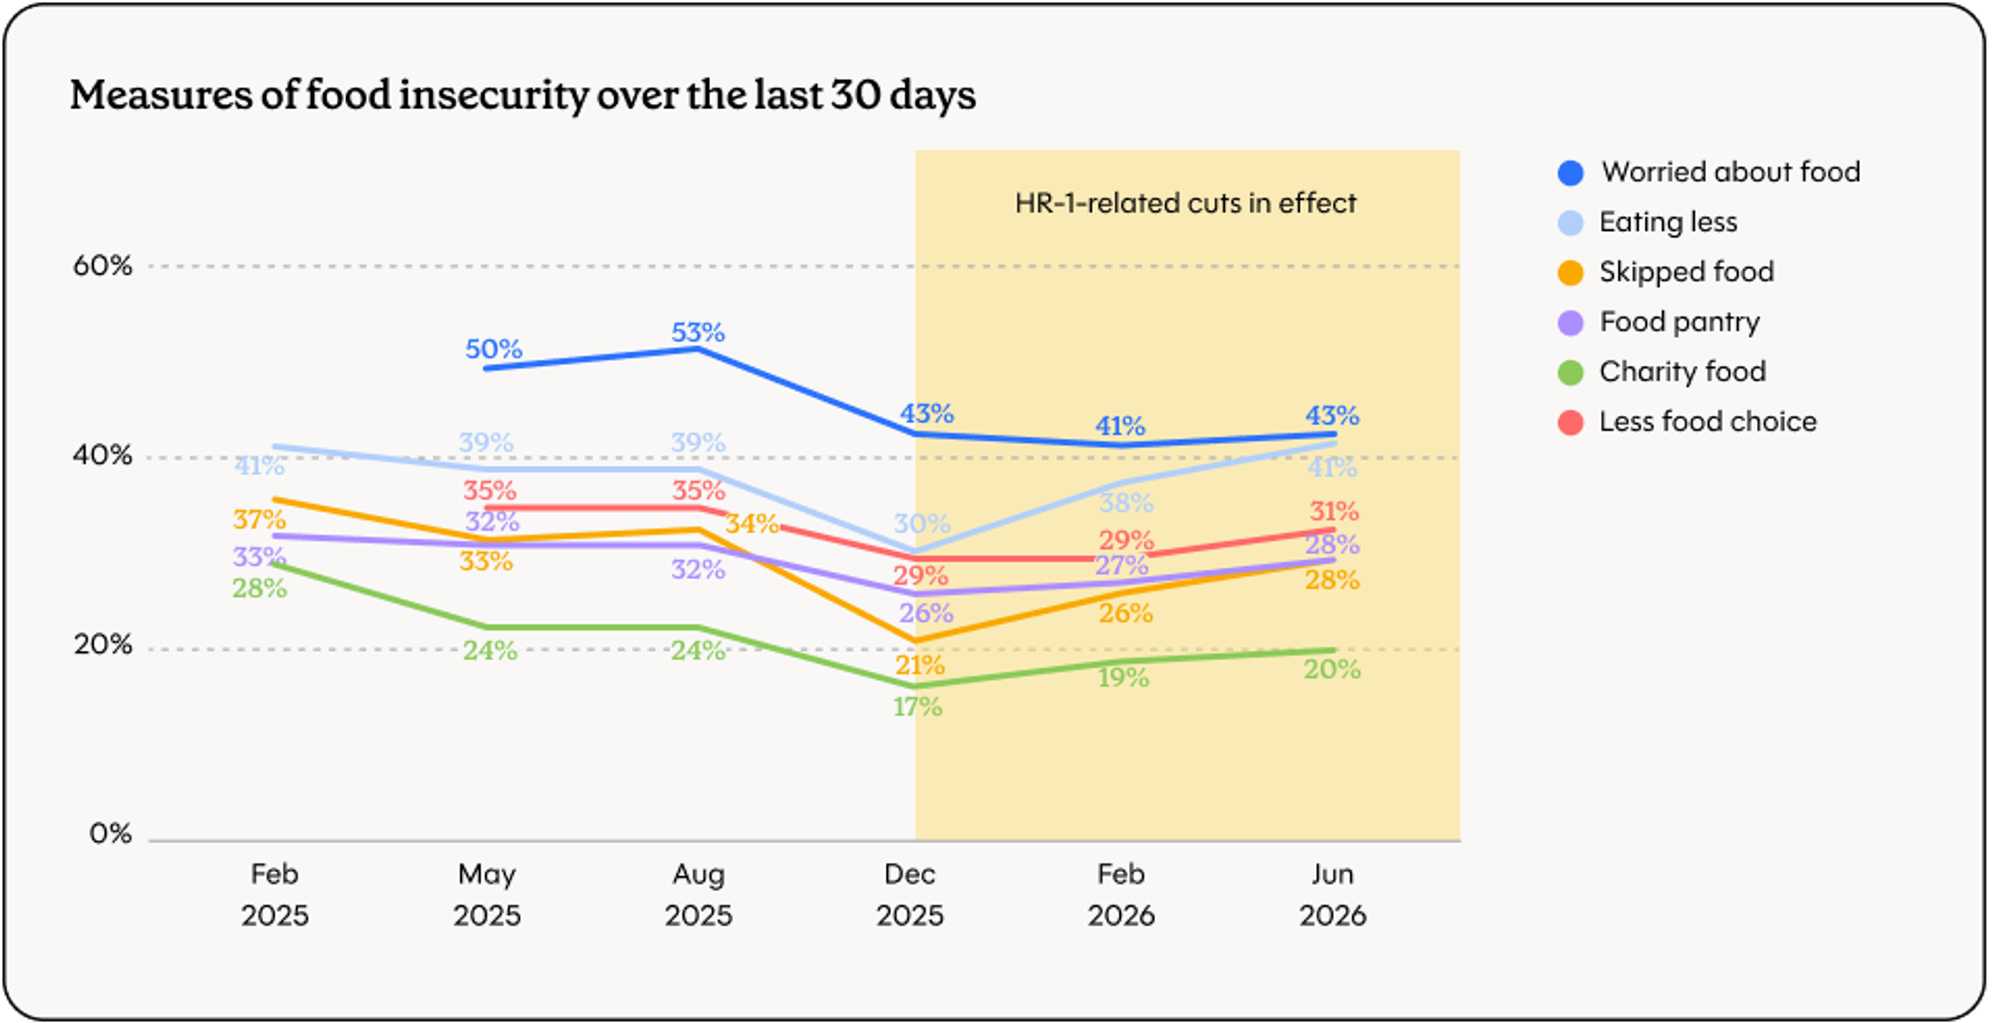
Food insecurity indicators were mixed this quarter. Eating less (41%) is the highest level recorded since 2024. Eating less and skipping meals are the only two measures in this section that have risen in every wave since December; the other four measures moved only slightly since February and remain below their 2025 levels. The stall in food security improvement since December appears concentrated in these two measures rather than across the board.
- 41% of respondents reported eating less in the last 30 days, up 3% since February 2026 and 11% since December 2025. This is roughly consistent with responses across the first three quarters of 2025.
- 28% reported skipping meals, up from 20% in December 2025 and up 2% since February 2026. This is a relative year-over-year decrease of 33%, though we are starting to see an upward trend through 2026.
- 42% said they are worried their food will run out before they can buy more, continuing a slight increase since December 2025, but 24% lower than August 2025.
- 30% were not able to buy the kinds of food they wanted, flat from both February 2026 and December 2025. This is a relative year-over-year decrease of 33%.
- 28% visited a food pantry in the last 30 days, a slight uptick from February and December 2025, but down from earlier in 2025.
- 20% relied on family or friends for groceries, a slight uptick from February 2026, but still down from February 2025.
"We usually go a week only being able to eat once a day." — Georgia SNAP recipient
"We run out of food earlier than expected and have to eat two meals a day and less fresh fruits and vegetables." — Illinois SNAP recipient
Housing & Financial Security#housing-and-financial-security
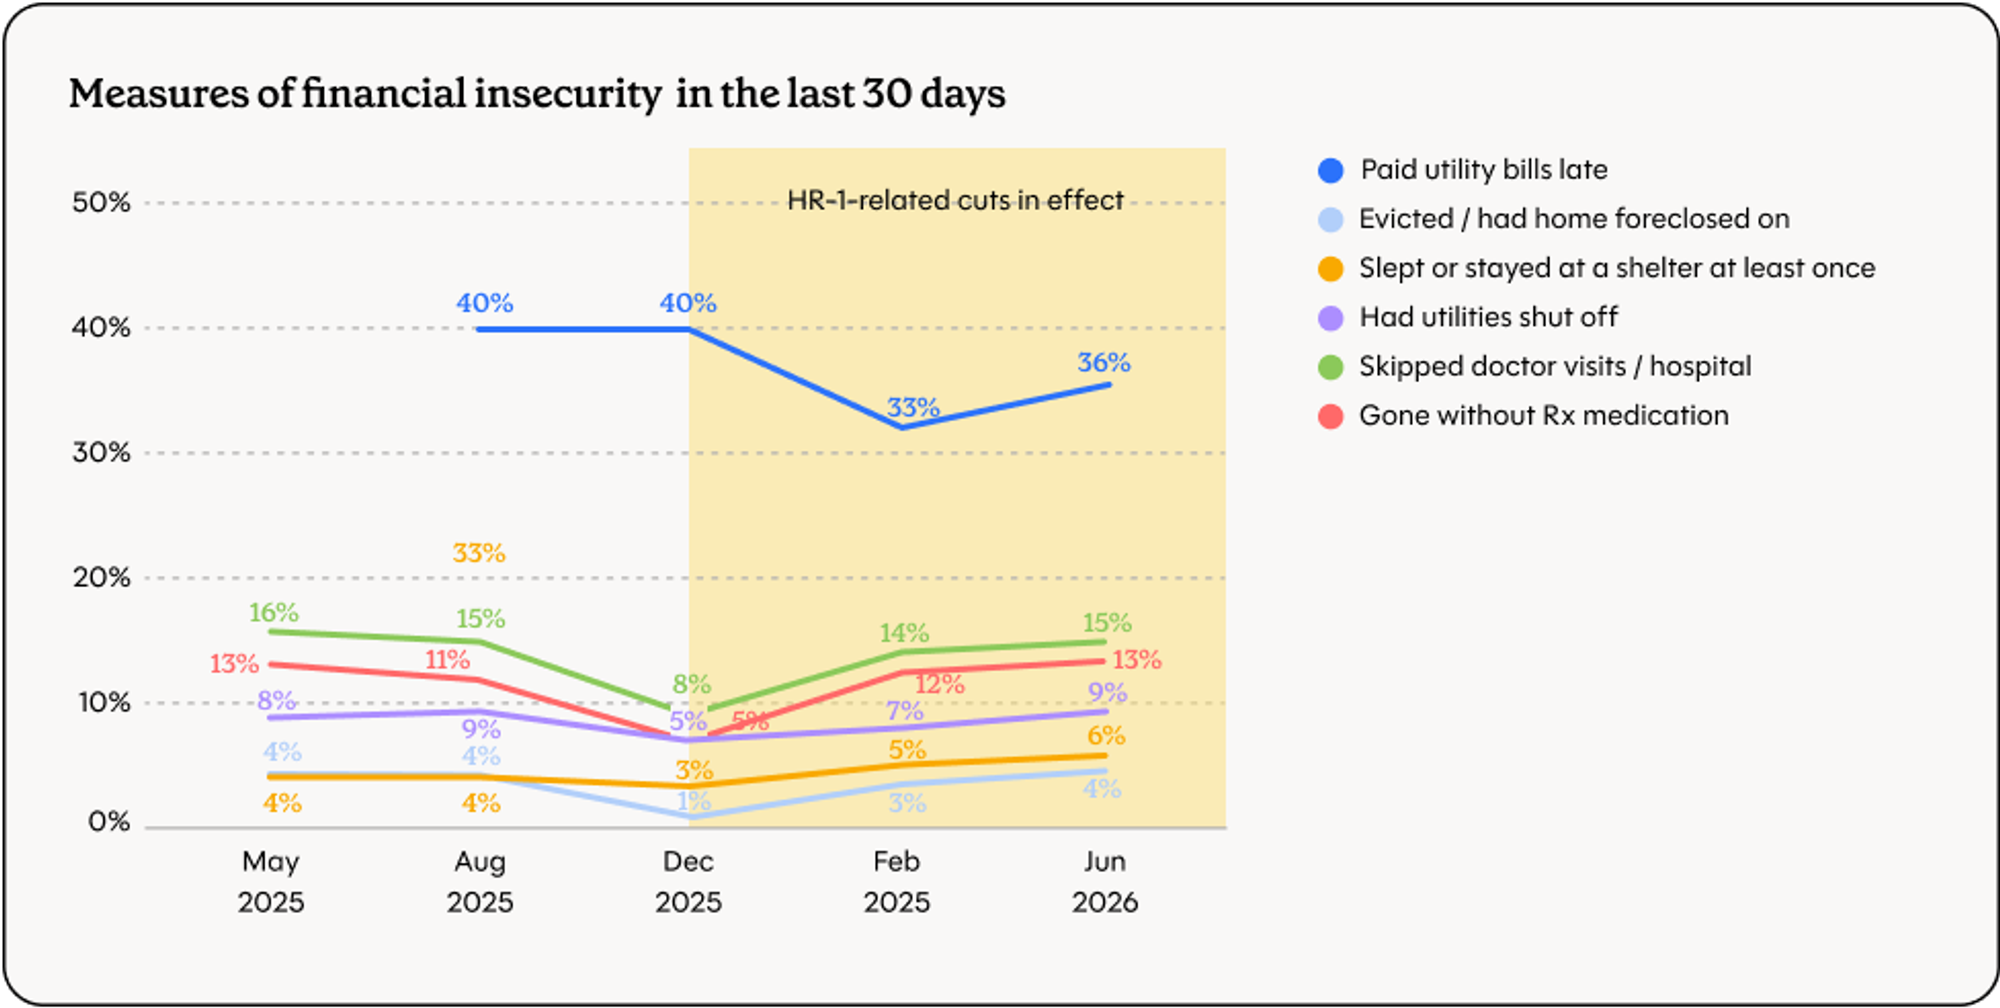
Housing and utility measures have increased both year-over-year and since December 2025. Shelter use and utility shut-offs are higher than they were a year ago, not just since December. Housing instability did not see the same mid-2025 improvement that food security did. Eviction is moving in the opposite direction, down slightly year-over-year.
- Shelter use in the past 30 days is up 41% year-over-year, and rose from 2% of respondents in December 2025 to 6% in the current survey.
- Utility shut-offs are up 5% year-over-year. Late utility bill payments rose from 32% of respondents in December 2025 to 37% in the current survey.
- Eviction or home foreclosure is flat year-over-year.
- 15% of respondents skipped a doctor's visit due to cost, up from 7% in December 2025.
- 13% skipped medication due to cost, up from 5% in December 2025.
"I've had to skip meals and I don't know day to day how I'm going to eat. It's either pay utilities or skip two out of three meals daily." — Kentucky SNAP recipient
Borrowing for Immediate Needs#borrowing-for-immediate-needs
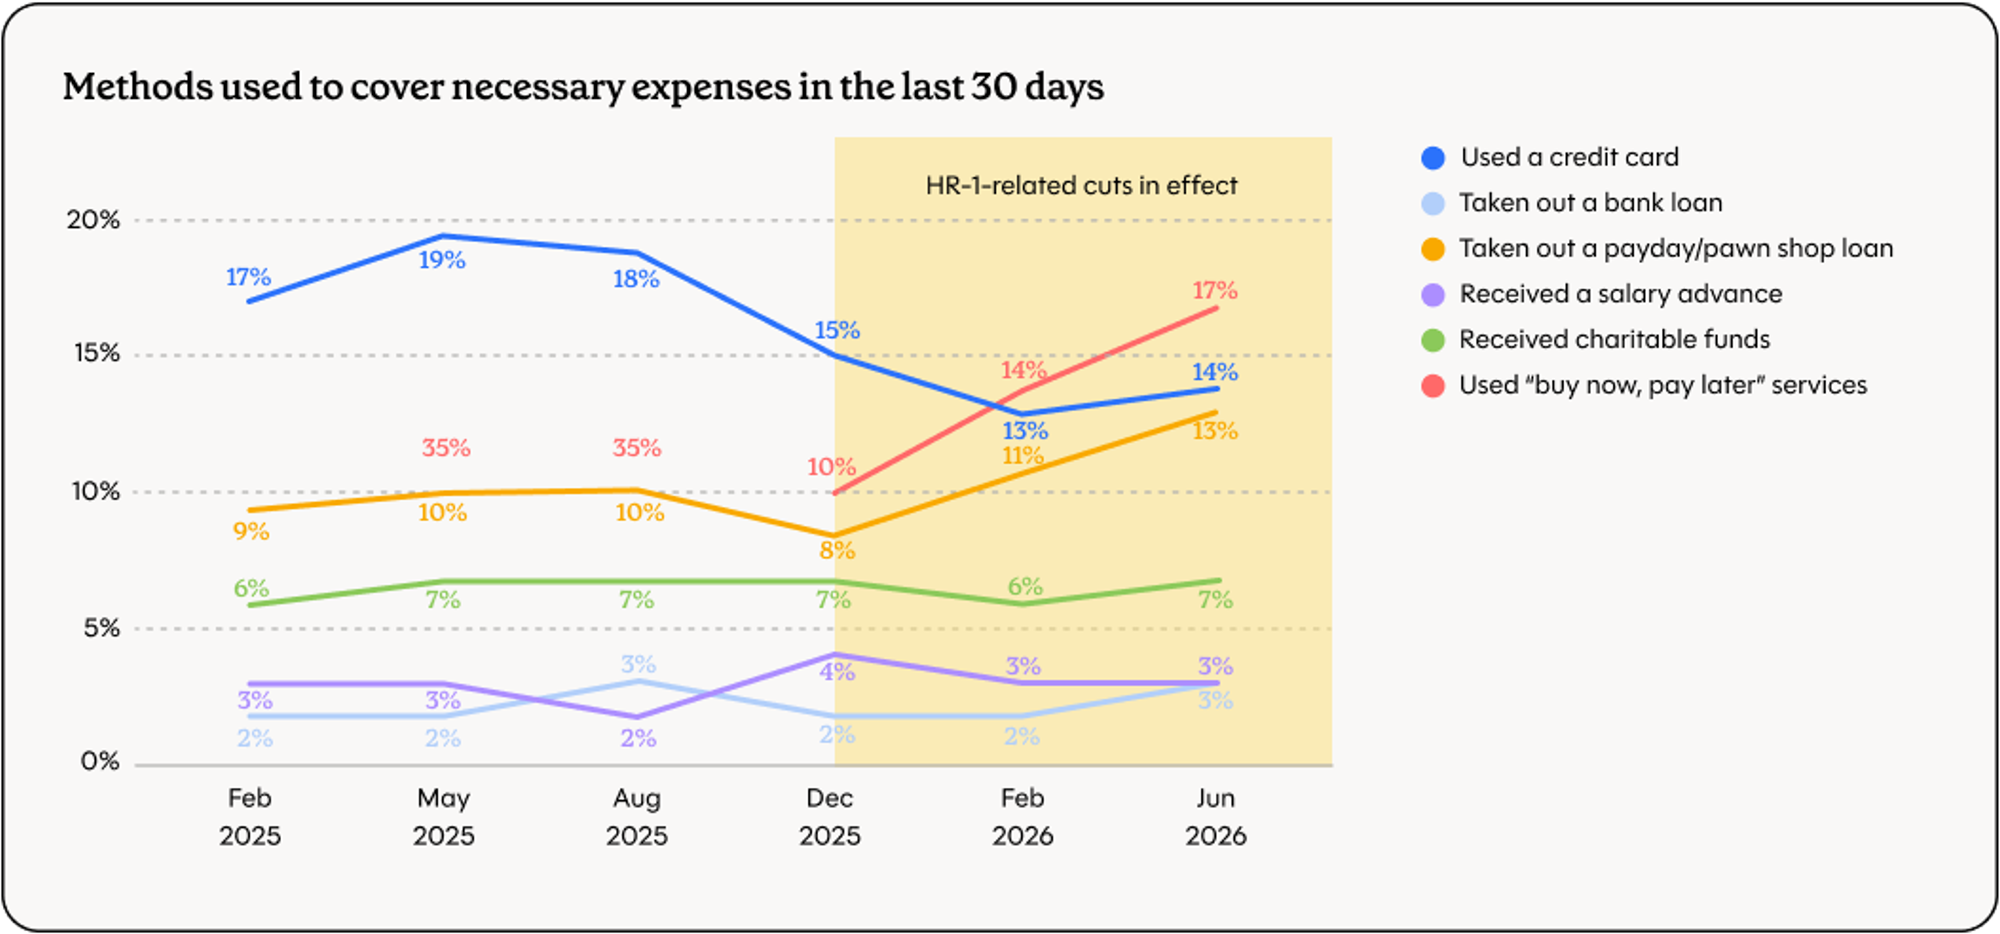
Short-term borrowing to cover immediate costs is concentrated in a narrower set of less traditional tools, while more conventional options are down or flat. Pawn shop/payday loans are up year-over-year, while bank loans, credit card use, salary advances, and charitable funds are all down or flat, and “buy now, pay later” (BNPL) keeps climbing since December as a newer, lower-friction option. Together this looks like a shift toward a narrower set of alternative tools to cover immediate costs, not a broad increase across every way households cover expenses.
- Bank loan use to cover costs in the last 30 days is flat since December and last year
- Pawn shop or payday loan has risen from 8% to 13% since December, a 23% relative increase year-over-year
- Buy now, pay later use has risen from roughly 8% of respondents in December 2025 to roughly 17% in the current survey. This is a newer product we recently began tracking as it has grown in popularity among respondents, so no year-over-year comparison is available yet.
- Credit card use to cover expenses is down year-over-year; salary advance use is flat; use of charitable funds to cover expenses is down 6%.
"I use [BNPL platform] often towards the end of the month to afford feeding my family." — Pennsylvania SNAP recipient
Debt & Signals of Financial Stability#debt-and-signals-of-financial-stability
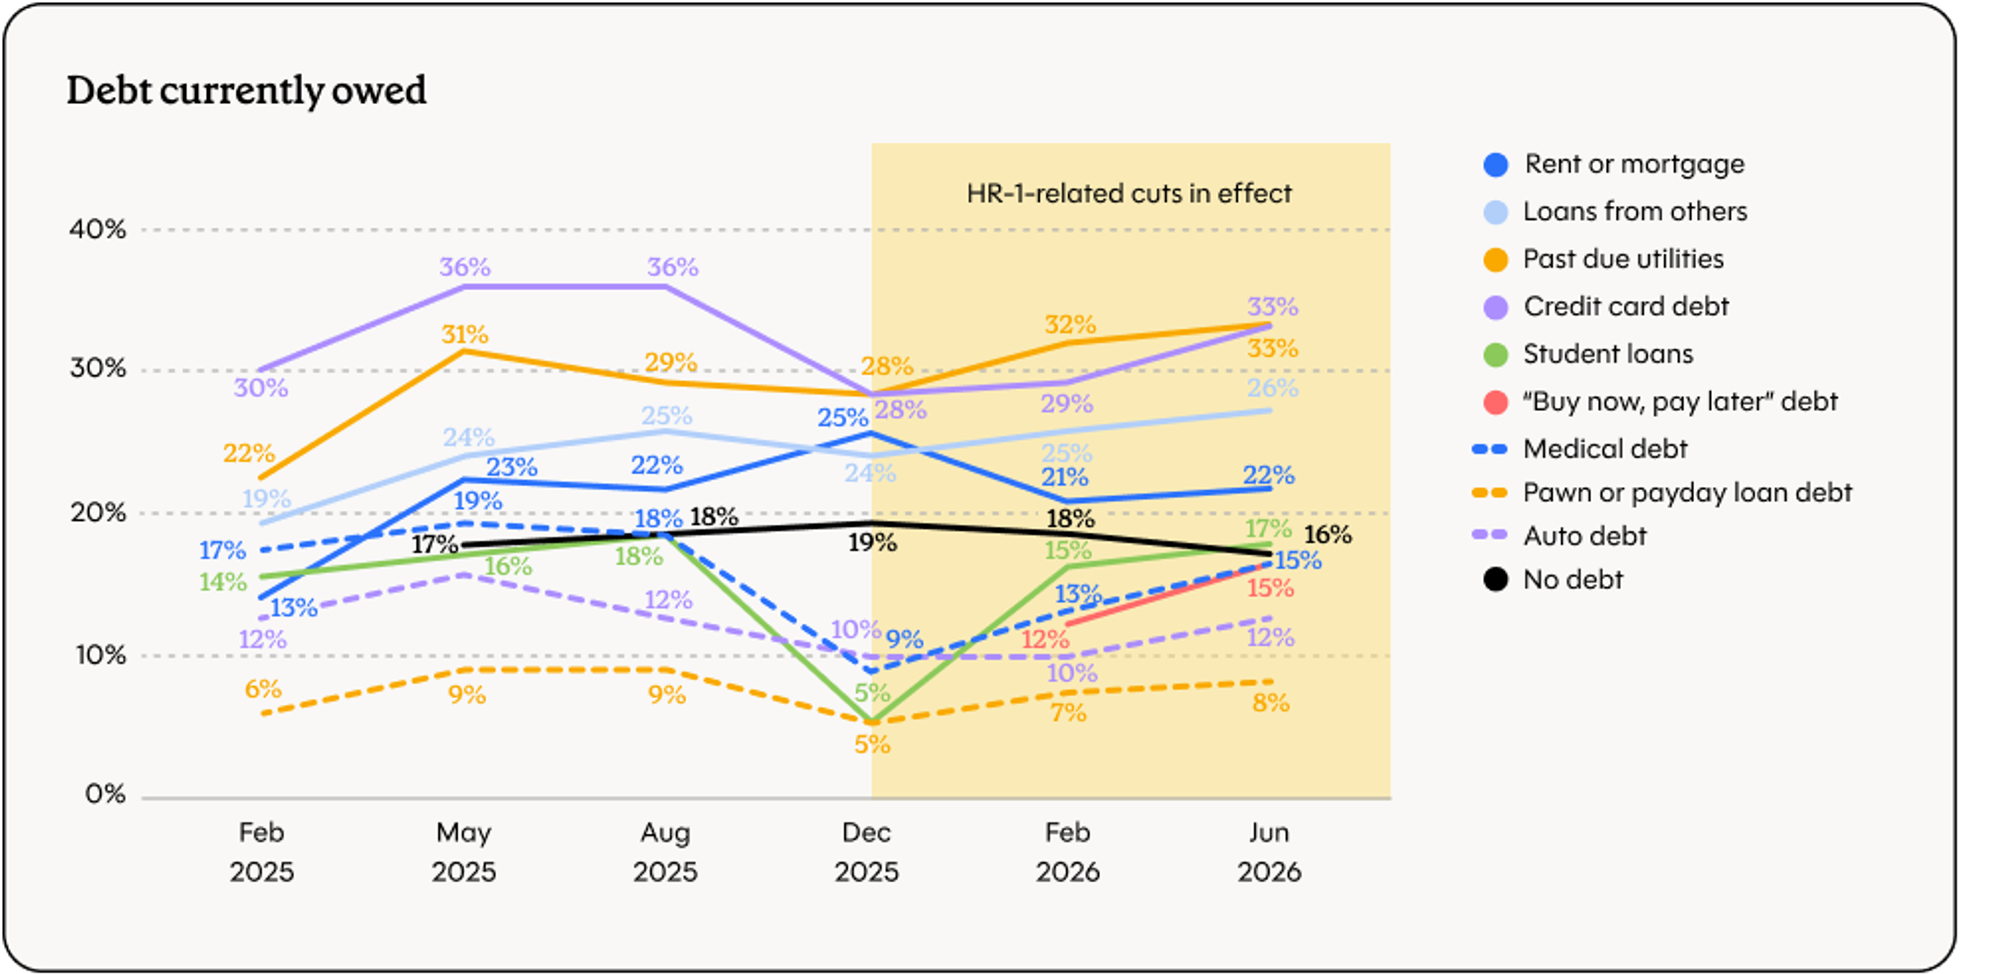
Debt levels are a slower-moving measure of financial stability than the immediate-needs borrowing above and the categories that are climbing suggest that households haven't been able to catch up, not just that households are borrowing more this month.
Family and friend debt, utility debt, and student loan debt are the categories climbing year-over-year, while credit card, medical, auto, and rent or mortgage debt, and the share who are debt-free, are all down. Several of these categories reportedly declined between August and December 2025 before climbing back since. The improvement households saw last year didn't stick, and the categories now rising are the ones tied most directly to everyday costs and informal borrowing from family, rather than larger, more traditional forms of debt.
- The share of respondents who are debt-free is down 7% year-over-year.
- Debt owed to family or friends is up 9% year-over-year.
- Utility debt is up 7% year-over-year.
- Student loan debt is up 6% year-over-year.
- Credit debt is down 8% year-over-year, medical debt is down 24%, auto debt is down 15%, and rent or mortgage debt is down 3%.
- Pawn or payday loan debt held is down 7% year-over-year.
- Buy now, pay later debt is on the rise, but doesn't have a year-over-year comparison yet.
"Our benefits were reduced and our credit cards are maxed out so we had to stop making the high payments on them so we could buy food and try to keep the utility bills from getting too far behind." — Michigan SNAP recipient
Work Requirements#work-requirements
Exposure to SNAP work requirements is broad: 47.5% of respondents currently have to verify their work hours to keep SNAP benefits, 35% say they're exempt, and 17.4% aren't sure. (For more on how we've helped SNAP recipients understand these requirements, see " Helping a million SNAP recipients navigate work requirement changes".
Notice rates held flat quarter over quarter at around 26% of respondents that received a letter from their state about work or volunteer requirements in the past six months. But the reported outcomes for those who got a notice worsened. More people (41.4% of respondents) experienced a negative change in their benefits (stopped, reduced, or told they would reduce), up from 39% in Q1.
"It really hurts. I went from getting $298 down to $24! My income switched from SSI to SSDI and even though I get more money, I'm still struggling. Food prices are high right now… I usually eat one regular meal a day plus a very, very light breakfast. I run out of food money halfway through each month. I don't know how they expect someone to survive on $24!" — Michigan SNAP recipient
"Due to increased income due to work requirements I have to be away from my children more. As a single mom household I now have to pay child care and car expenses which takes away from my income leaving it harder to afford groceries to feed my kids." — California SNAP recipient